CASCADE 2.0 Data Analysis
We will perform the same analysis as in the previous section, only now for a randomly selected sample of models from the CASCADE 2.0 topology.
CASCADE 2.0 represents a larger topology/network with nodes with more than \(5\) regulators and as such we expect to see even more agreement between stable state activity and link operator assignment for these nodes (which will be a proof-of-concept for the link operator bias).
Data
The dataset used was generated for another analysis and we are going to use part of it, i.e. the models that had 1 stable state (see get_node_stats_cascade_2.R script).
The dataset is stored in Zenodo ![]()
Load the CASCADE 2.0 node_stats_cascade2:
Parameterization vs Activity
The next Figure shows the total percent agreement for each link operator node in CASCADE 2.0 (a total of \(52\) nodes), which is the number of models for which parameterization and stable state matched divided by the total amount of models (\(20672\)):
node_stats_cascade2 %>% mutate(node = forcats::fct_reorder(node, desc(num_reg))) %>%
  ggplot(aes(x = node, y = obs_prop_agreement, fill = as.factor(num_reg))) +
    geom_bar(stat = "identity") +
    scale_y_continuous(labels=scales::percent) +
    labs(title = "Agreement between Link Operator Parameterization and Stable State Activity", x = "Target Nodes with both activating and inhibiting regulators", y = "Percent Agreement") +
    theme_classic() + theme(axis.text.x = element_text(angle = 90)) +
    scale_fill_brewer(guide = guide_legend(reverse=TRUE, title = "#Regulators"), palette = "Spectral") +
    geom_hline(yintercept = 0.5, linetype = 'dashed')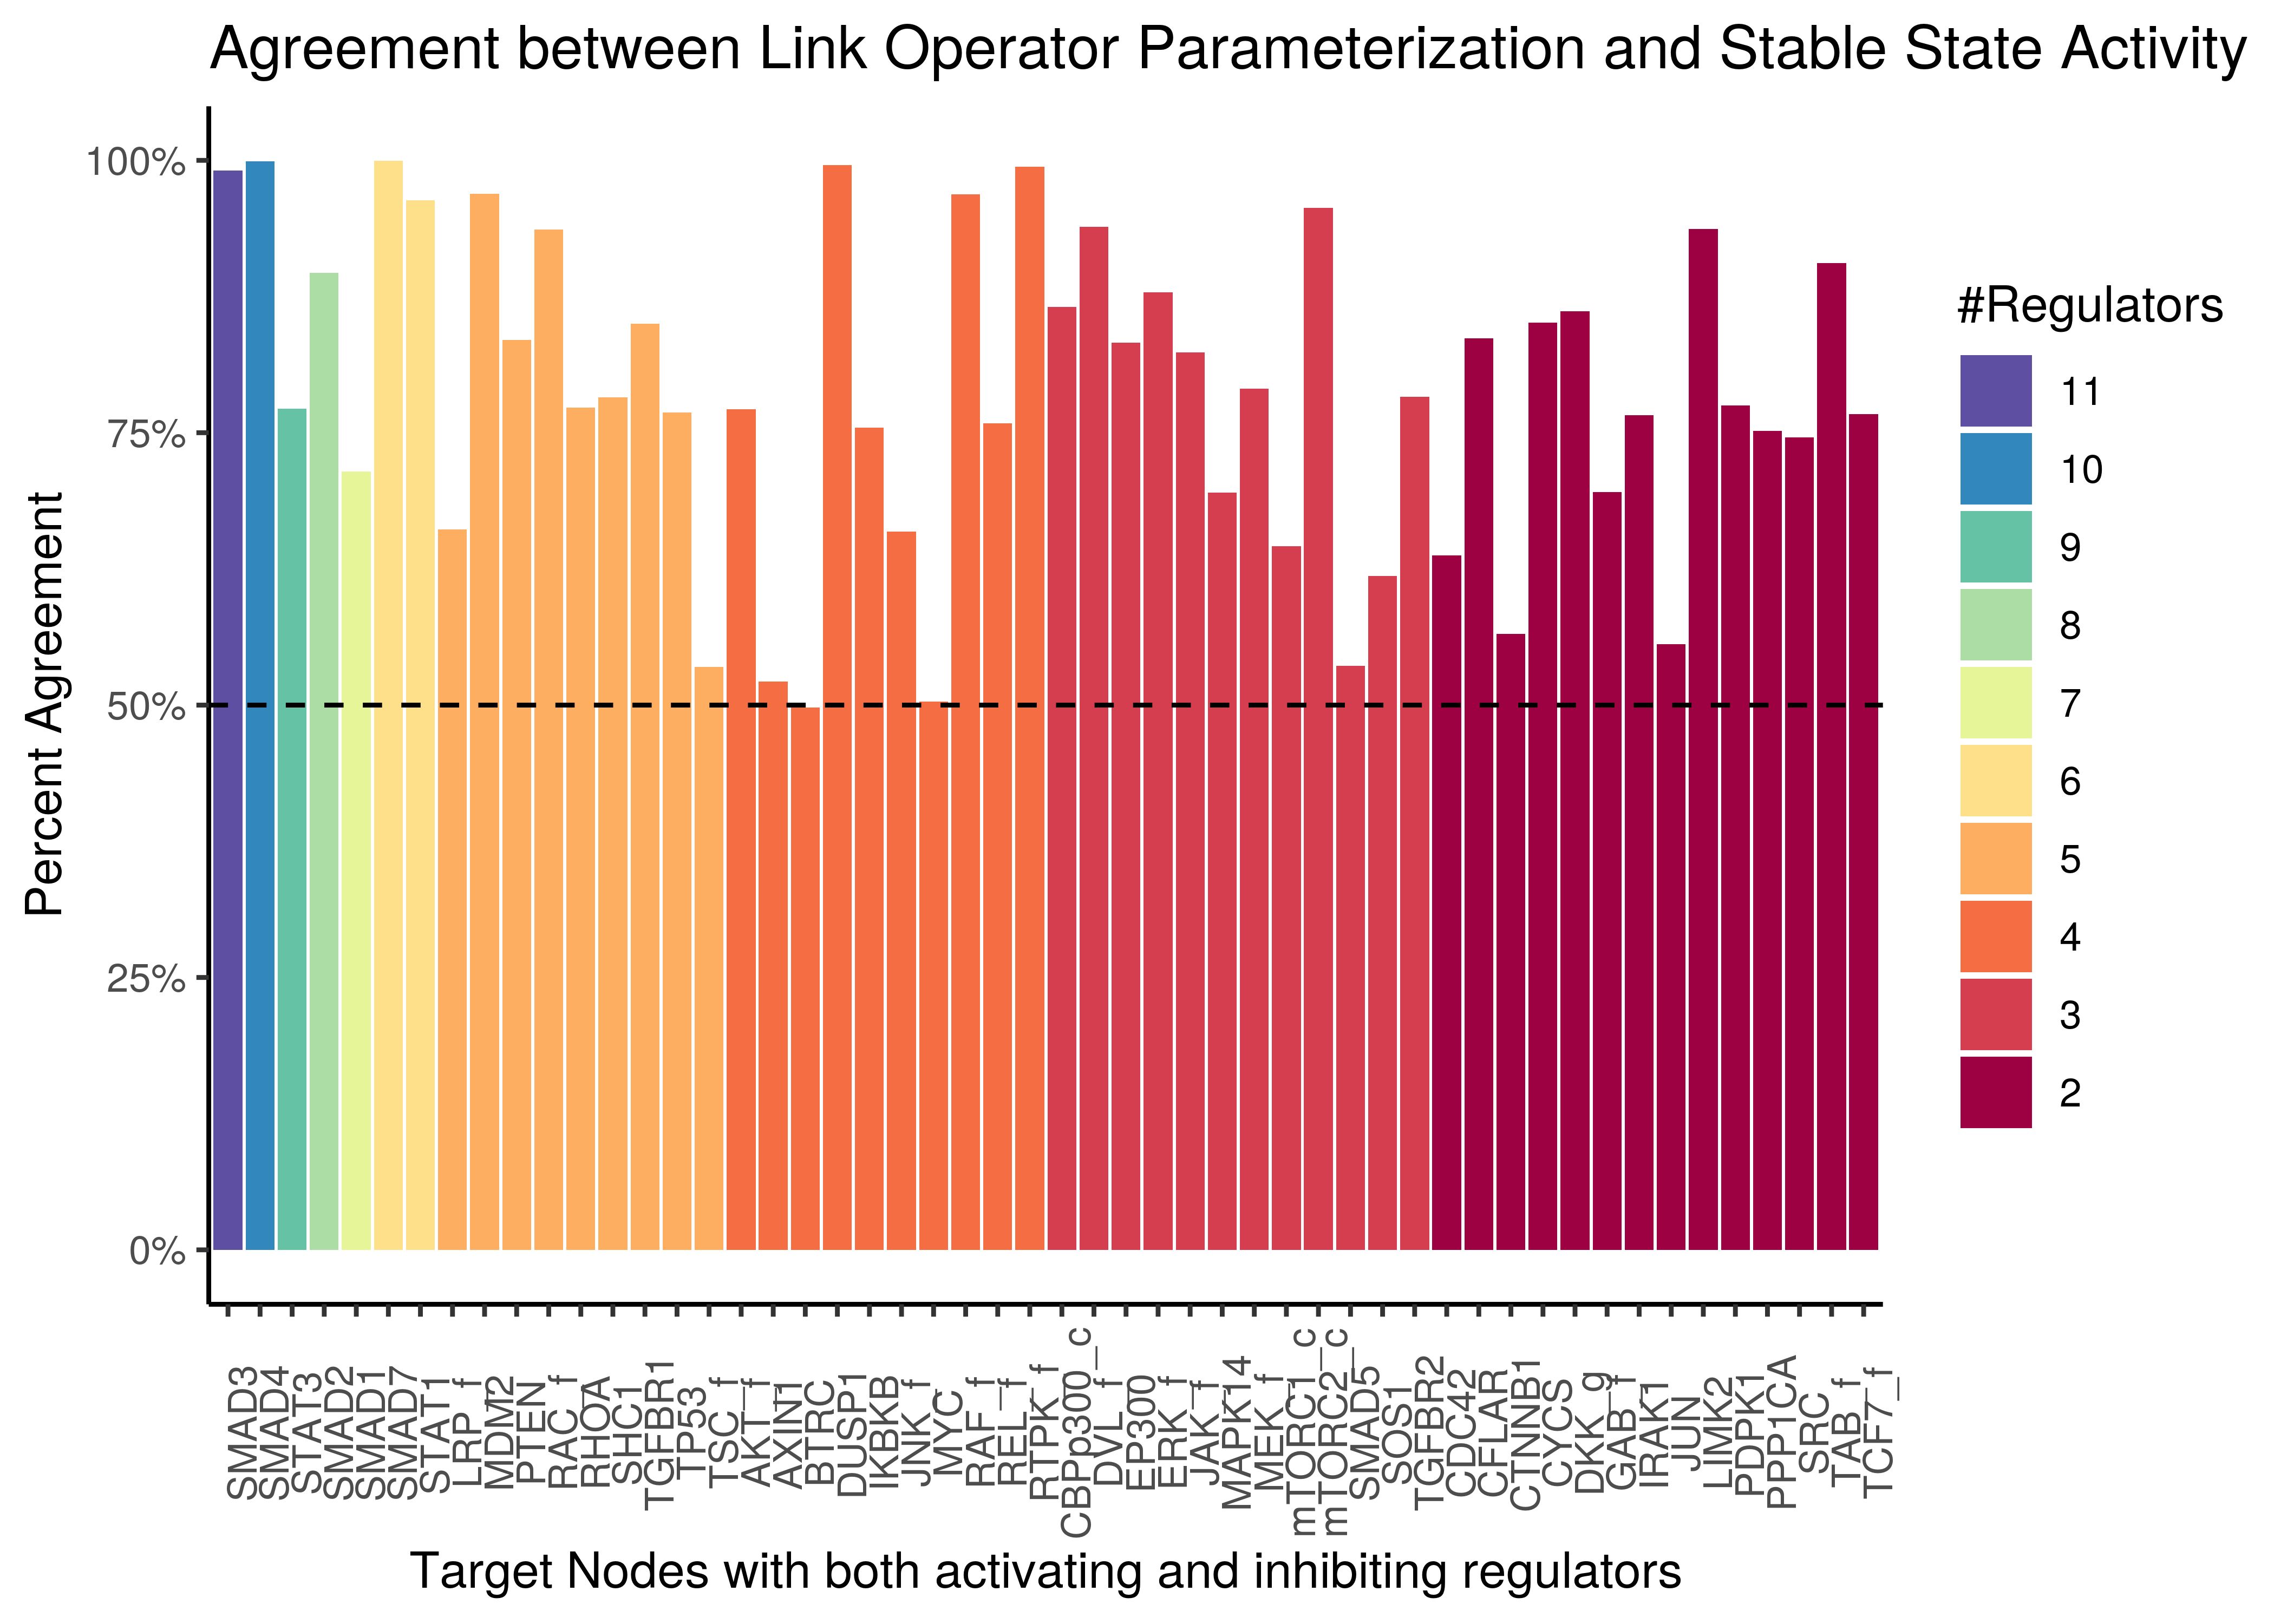
Figure 20: Parameterization and Stable State activity agreement (CASCADE 2.0)
The total barplot area covered (i.e. the total agreement score so to speak) is 78.6334916%.
In the next two figures, we separate the nodes to \(3\) groups based on the number of regulators they have and show both the percent agreement and Cohen’s \(\kappa\) statistic (see note):
node_stats_cascade2 %>% mutate(reg_group =
    factor(case_when(num_reg >= 6 ~ ">5", num_reg <= 3 ~ "2-3", TRUE ~ "4-5"), levels = c("2-3", "4-5", ">5"))) %>%
  ggplot(aes(x = reg_group, y = obs_prop_agreement, fill = reg_group)) +
    geom_boxplot(show.legend = FALSE) +
    geom_jitter(shape = 19, position = position_jitter(0.2), show.legend = FALSE) +
    scale_y_continuous(labels = scales::percent, limits = c(0,1)) +
    labs(title = "Agreement (parameterization vs stable state activity)", x = "Number of Regulators", y = "Percent Agreement") +
    geom_hline(yintercept = 0.5, linetype = 'dashed', color = "red") +
    theme_classic(base_size = 14) +
    theme(axis.text.x = element_text(size = 15))

node_stats_cascade2 %>% mutate(reg_group =
    factor(case_when(num_reg >= 6 ~ ">5", num_reg <= 3 ~ "2-3", TRUE ~ "4-5"), levels = c("2-3", "4-5", ">5"))) %>%
  ggplot(aes(x = reg_group, y = cohen_k, fill = reg_group)) +
    geom_boxplot(show.legend = FALSE) +
    geom_jitter(shape = 19, position = position_jitter(0.2), show.legend = FALSE) +
    ylim(c(0,1)) +
    labs(title = "Cohen's k (parameterization vs stable state activity)", x = "Number of Regulators", y = latex2exp::TeX("$\\kappa$")) +
    geom_hline(yintercept = 0.6, linetype = 'dashed', color = "red") +
    geom_text(aes(x = 3.4, y = 0.55), label=latex2exp::TeX("$\\kappa$ = 0.6")) +
    theme_classic(base_size = 14) +
    theme(axis.text.x = element_text(size = 15))
## Warning in is.na(x): is.na() applied to non-(list or vector) of type
## 'expression'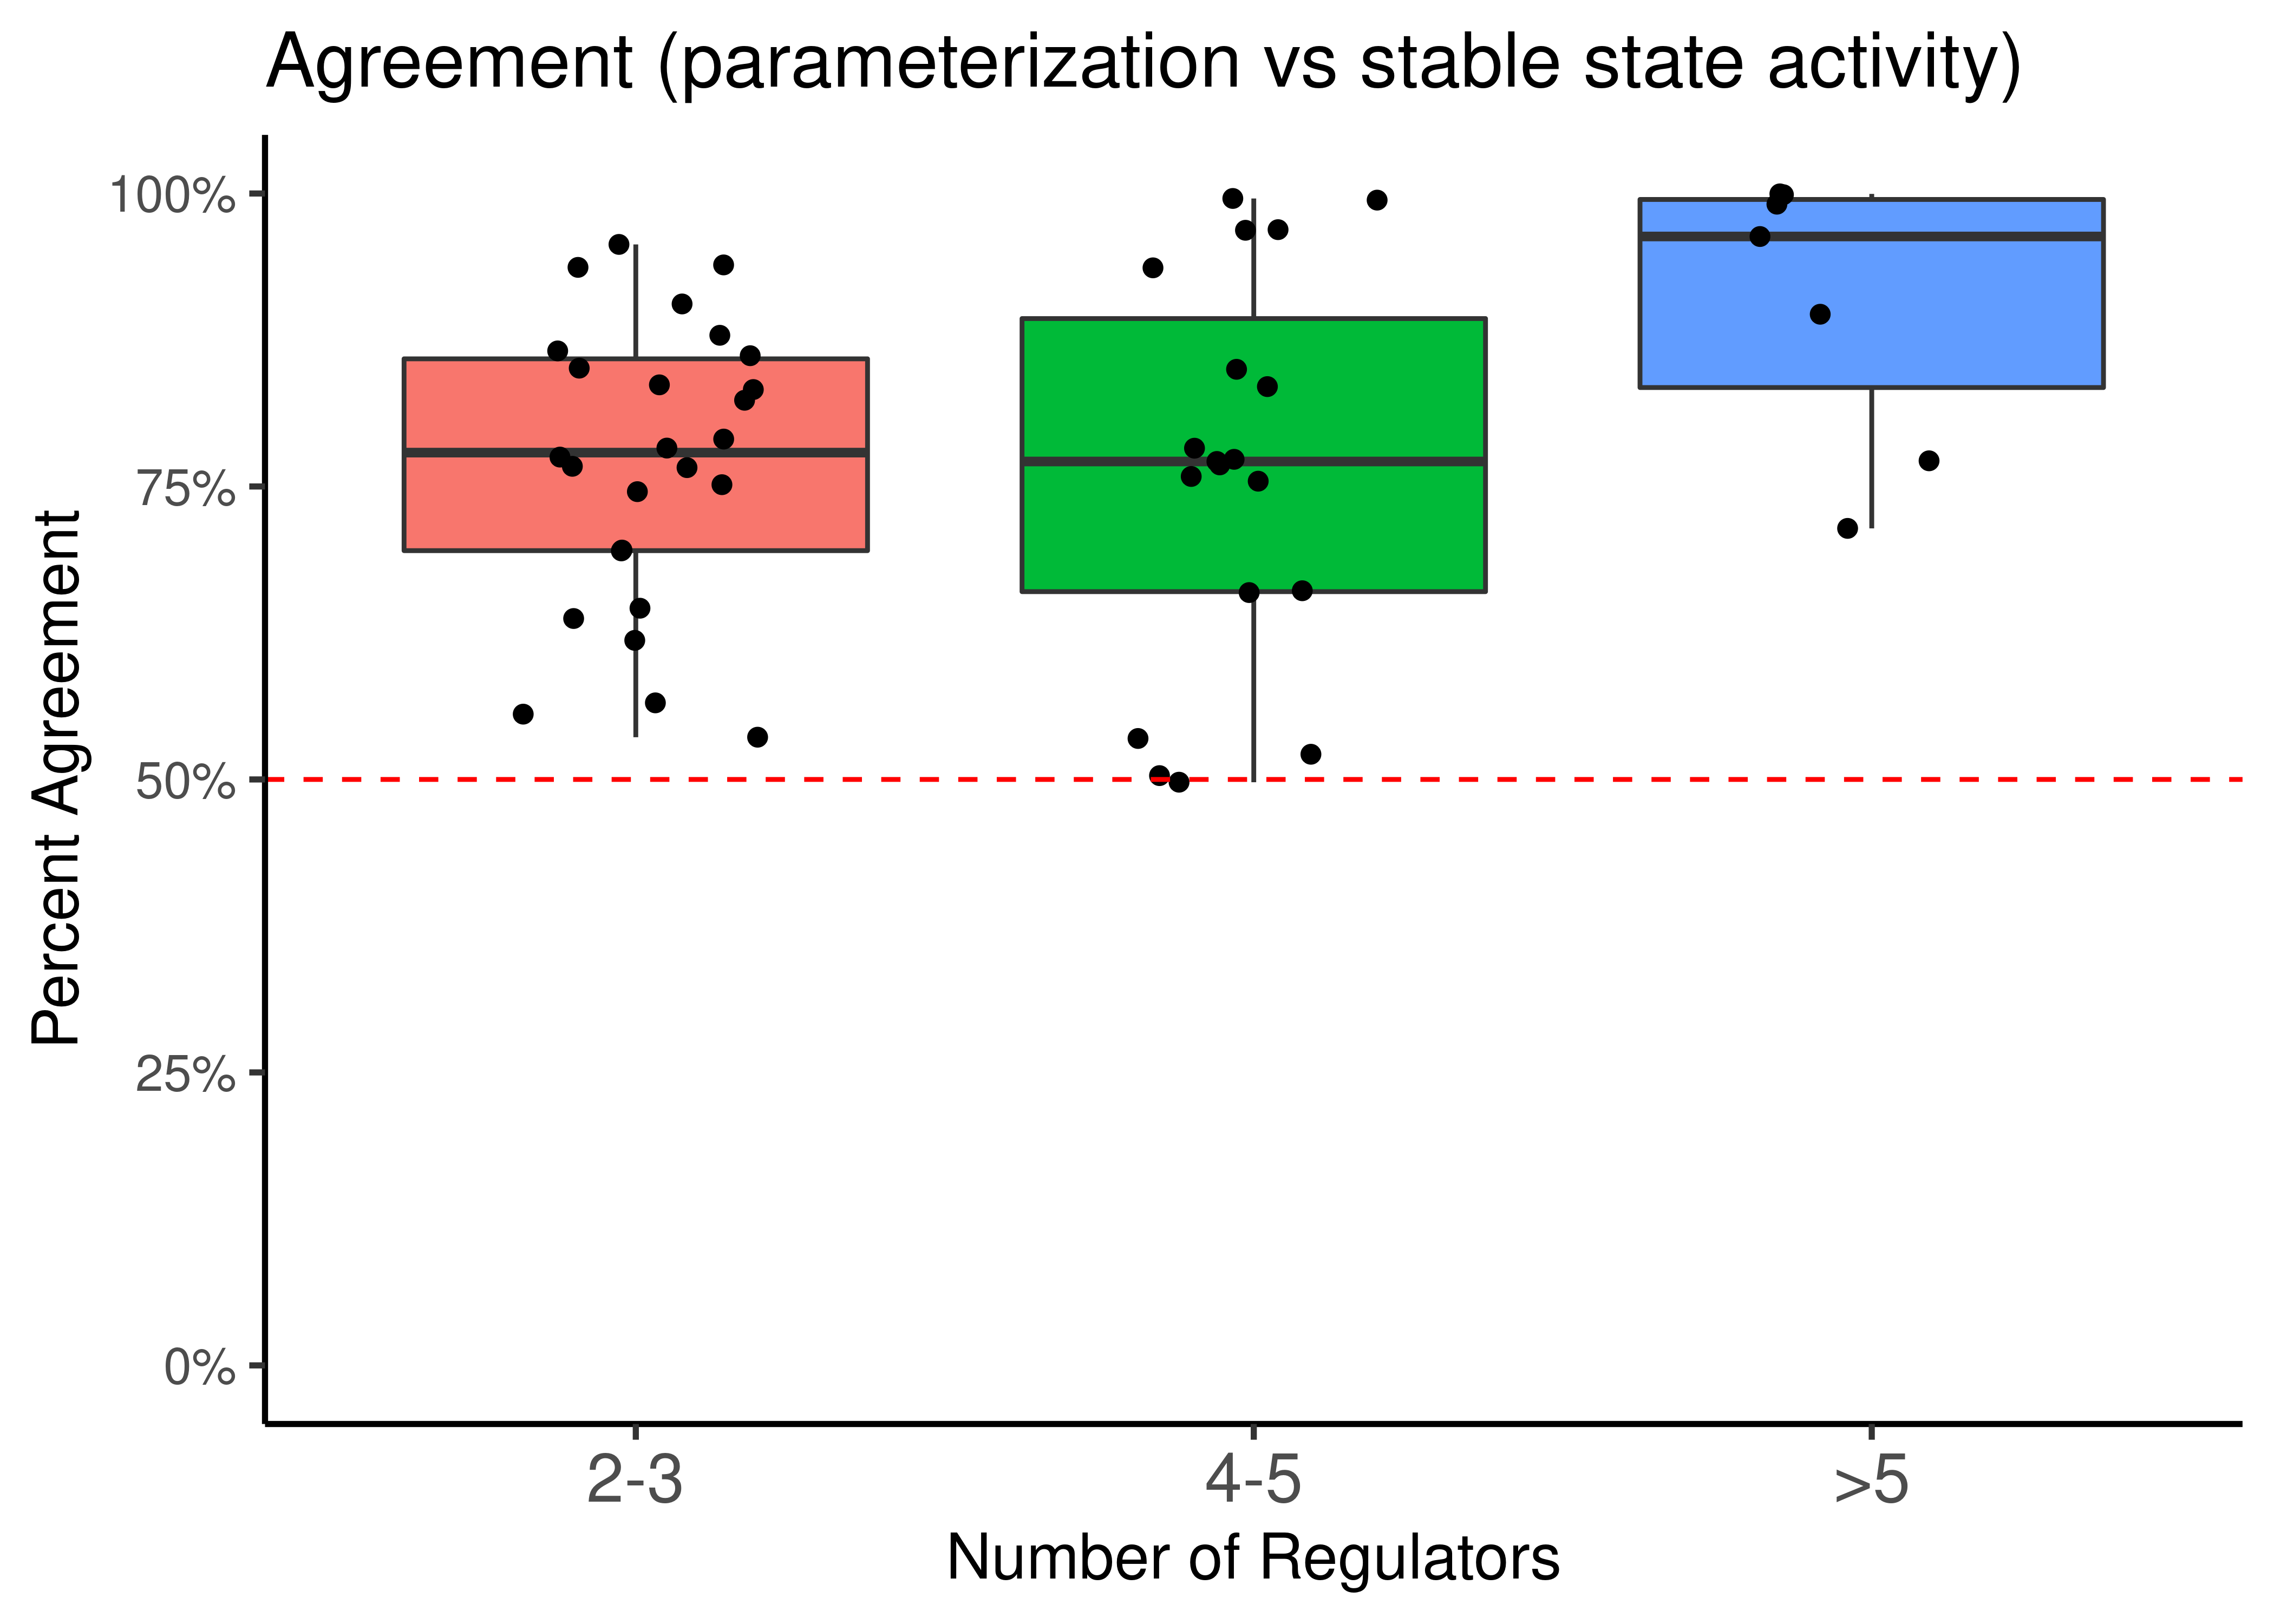
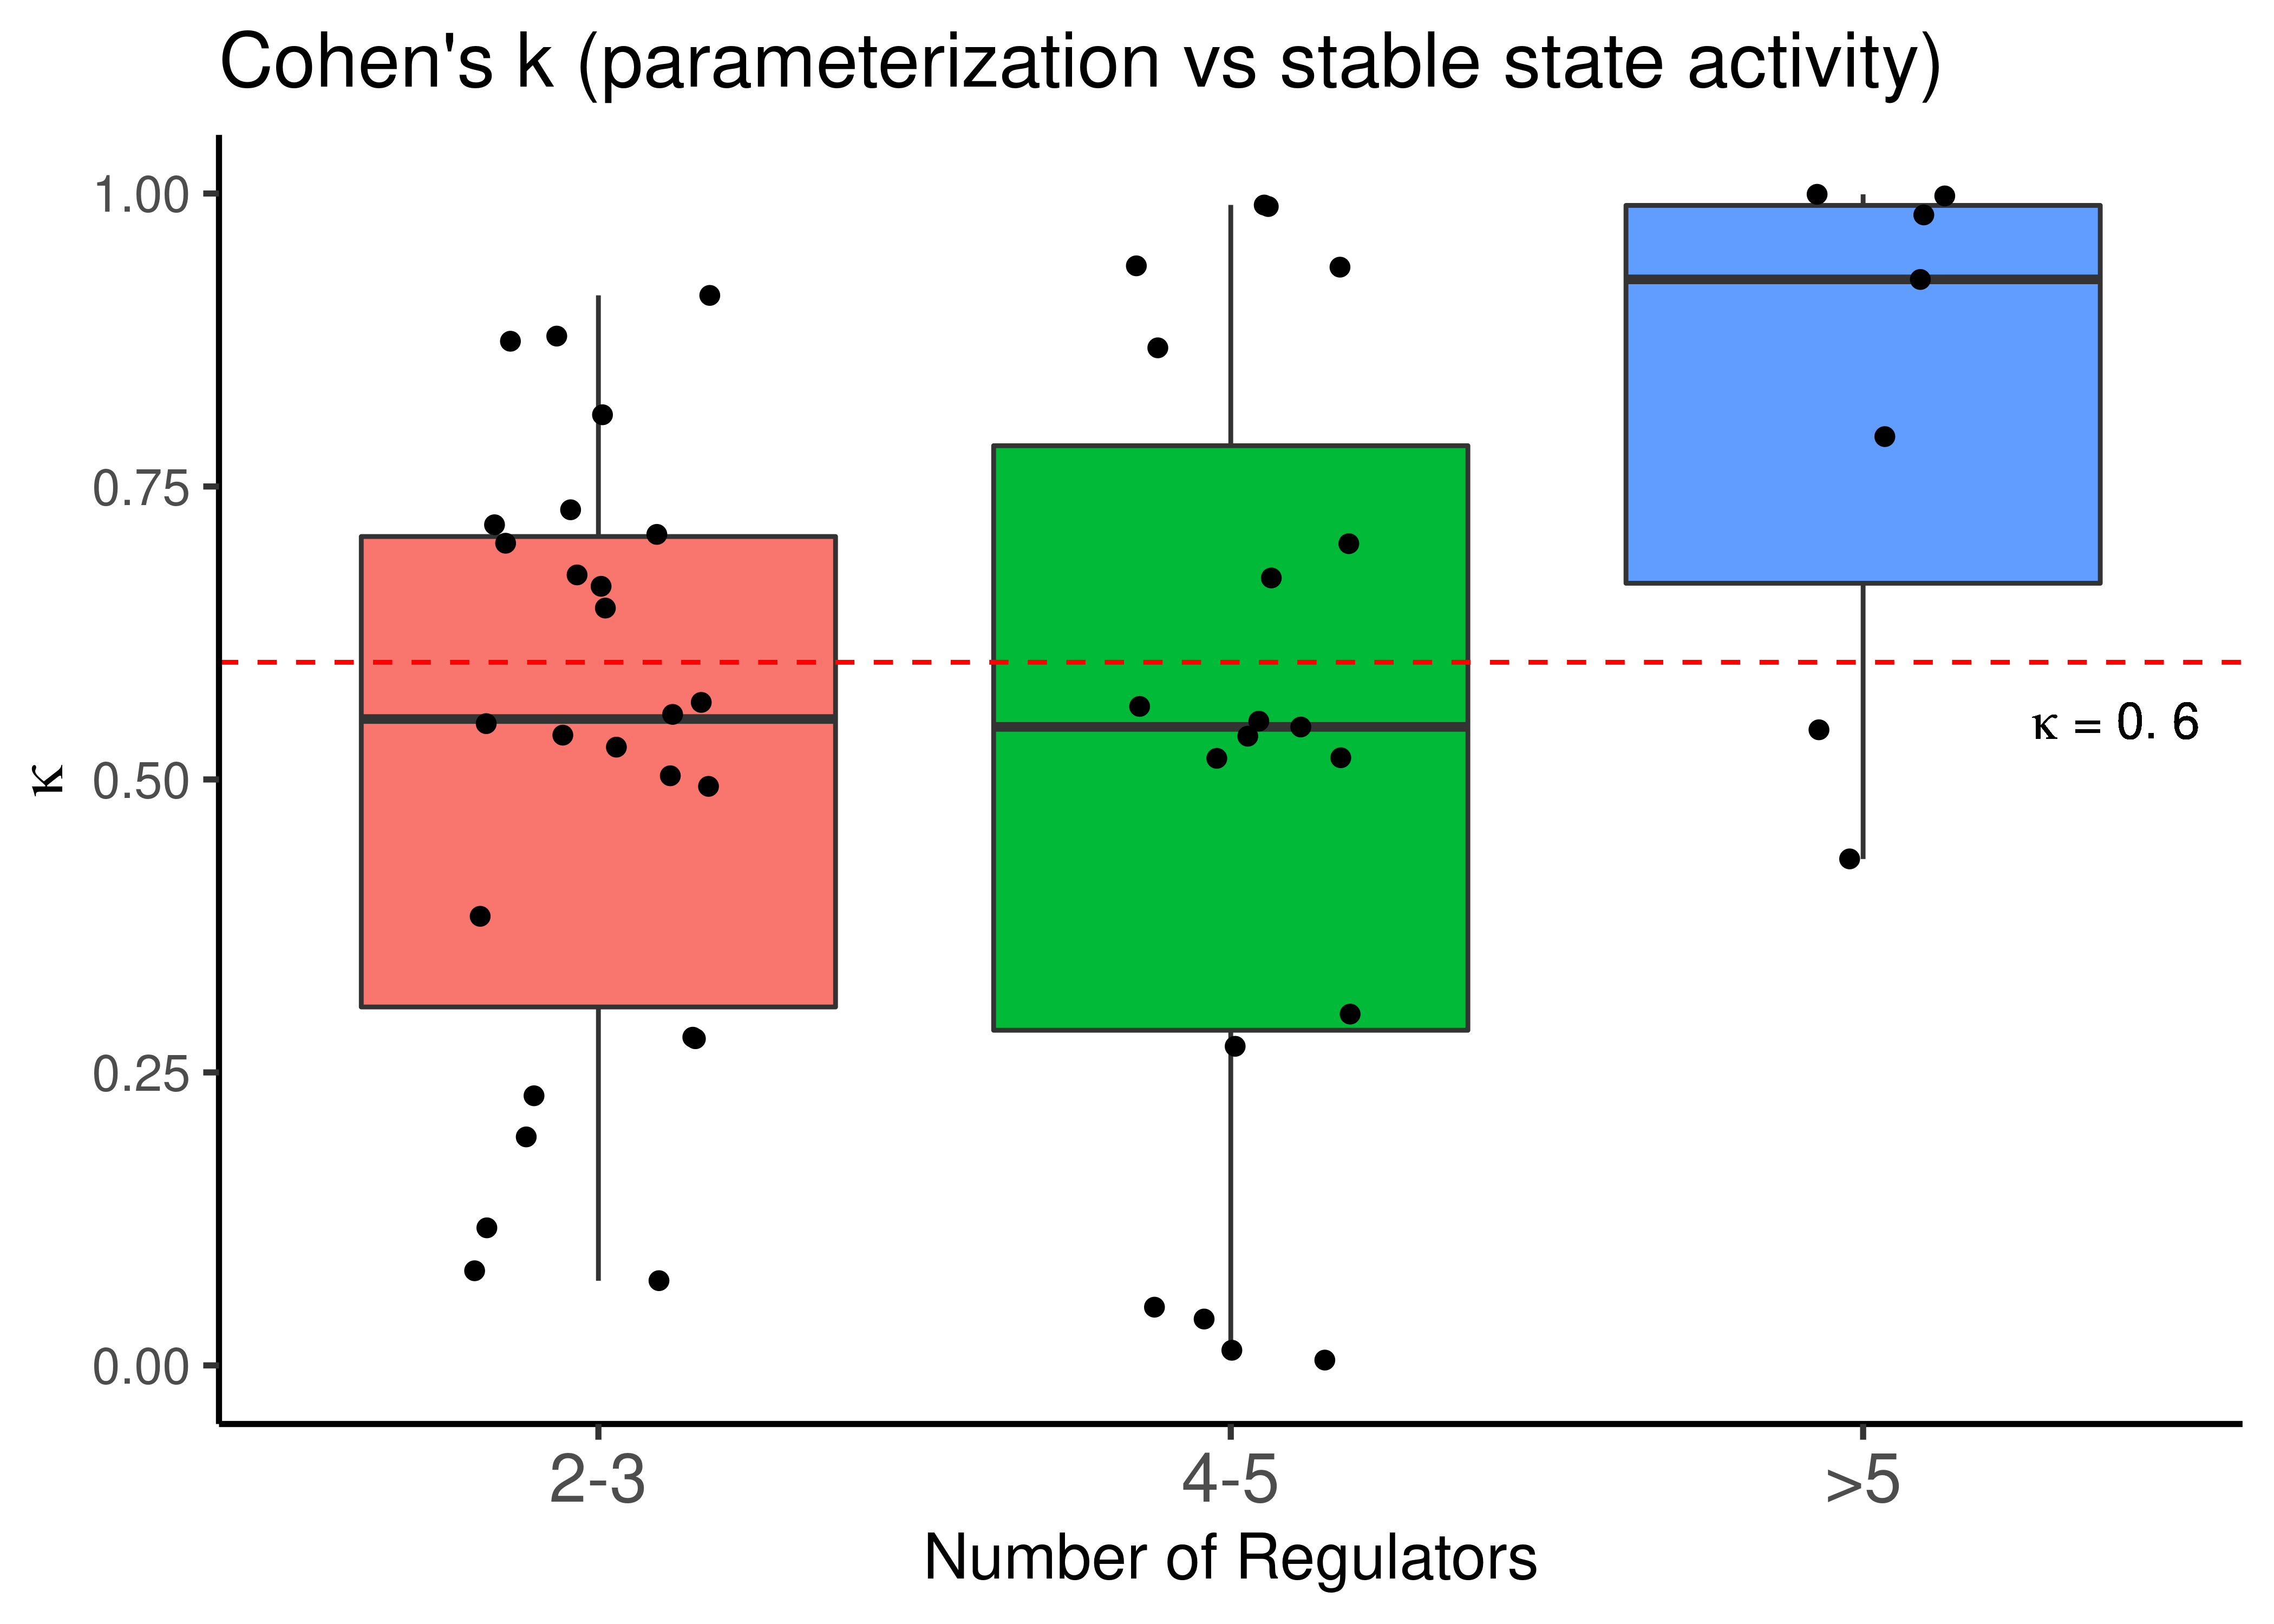
Figure 21: Parameterization and Stable State activity agreement. CASCADE 2.0 link operator nodes are grouped based on their respective number of regulators
The nodes with number of regulators \(>5\) have always a percent agreement \(\geq 75\%\) between stable state activity and link operator parameterization and \(\kappa_{median}>0.6\). The above results provide evidence that the statistics-based conclusion we reached in a previous section is correct, i.e. that the standardized Boolean formula is biased for larger number of regulators.