Biomarker comparison
In this chapter we will compare the biomarker results from 8 different cell
lines. These results were obtained through an ensemble model analysis, which was
performed on the models generated by the Gitsbe module when running the
DrugLogics computational pipeline for finding synergistic drug combinations
(drug pairs). The models in each different cell line setup were trained towards
a specific signaling activity profile matching the activity state of that
particular cell line. For more info about the cell line specific model &
biomarker analysis, see the respective chapters:
- A498 Model Analysis
- AGS Model Analysis
- DU145 Model Analysis
- Colo205 Model Analysis
- SW620 Model Analysis
- SF295 Model Analysis
- UACC62 Model Analysis
- MDA-MB-468 Model Analysis
Note that the biomarkers identified in the aforementioned chapters, were classified as:
- Performance-related biomarkers, which represent important nodes that are essential for our models to achieve a higher model performance classification (the methodology was based on the number of true positives (\(TP\)) and the Matthews Correlation Coefficient score (\(MCC\))
- Per synergy predicted biomarkers, which represent important nodes that are essential for our models to predict some of the synergies that were observed in the lab
In each category, the biomarkers can be either in an active state or in an
inhibited state. The input for the simulations and the output data are in the
cell-lines-2500 directory (the 2500 number denotes the number of simulations
executed). The analysis will be presented step by step in the sections below.
Input
Firstly, we define the necessary input (cell line names, directories and files of interest, etc.):
cell.lines = c("A498", "AGS", "DU145", "colo205", "SW620", "SF295", "UACC62", "MDA-MB-468")

cell.line.dirs = sapply(cell.lines, function(cell.line) {
  paste0(getwd(), "/", cell.line)
})

biomarkers.dirs = sapply(cell.line.dirs, function(cell.line.dir) {
  paste0(cell.line.dir, "/biomarkers")
})

observed.synergies.files = sapply(cell.line.dirs, function(cell.line.dir) {
  paste0(cell.line.dir, "/observed_synergies")
})

# get the drug combinations tested
model.predictions.file = paste0(cell.line.dirs[1], "/model_predictions")
model.predictions = get_model_predictions(model.predictions.file)
drug.combos = colnames(model.predictions)

# get the node names (same topology for all cell lines)
models.dir = paste0(cell.line.dirs[1], "/models")
node.names = get_node_names(models.dir)
Random Model Analysis
In this section we provide a fast way to obtain the results regarding
the random (or topology-based) model analysis, which is the same for all cell lines: these
models were generated while trained/fitted to a general cell proliferation phenotype.
By changing the observed synergies per different cell line and using the general
analysis functions offered by the emba R package, we can easily get the
analysis raw results (without extra refinements that were done in each
subsequent per cell-line model analysis). First, some further input:
random.dir = paste0(getwd(), "/random")
random.model.predictions = get_model_predictions(paste0(random.dir, "/model_predictions"))
random.models.stable.state = as.matrix(
  read.table(file = paste0(random.dir, "/models_stable_state"), check.names = FALSE)
)

observed.synergies.per.cell.line = sapply(observed.synergies.files,
  function(file) {
    get_observed_synergies(file)
  }
)
For the performance-related biomarker analysis, we use the MCC classification as the default strategy for splitting the models to different performance classes.
# Performance Biomarkers for cell proliferation models
random.mcc.analysis.res =
  lapply(observed.synergies.per.cell.line, function(observed.synergies) {
    biomarker_mcc_analysis(random.model.predictions,
                           random.models.stable.state,
                           models.link.operator = NULL,
                           observed.synergies, threshold = 0.6,
                           num.of.mcc.classes = 5, include.NaN.mcc.class = FALSE
                           )})

# Synergy Biomarkers for cell proliferation models
random.synergy.analysis.res =
  lapply(observed.synergies.per.cell.line, function(observed.synergies) {
    biomarker_synergy_analysis(random.model.predictions,
                               random.models.stable.state,
                               models.link.operator = NULL,
                               observed.synergies, threshold = 0.6)})
Performance Biomarkers
Next, we will visualize the performance biomarkers found from the cell-specific and random model analysis combined (per cell line):
# Cell-specific performance biomarkers
biomarkers.perf.res.cell.specific = get_perf_biomarkers_per_cell_line(biomarkers.dirs, node.names)

# Random models performance biomarkers
biomarkers.perf.res.random = as.data.frame(matrix(data = NA, nrow = 0, ncol = length(node.names)))
colnames(biomarkers.perf.res.random) = node.names

for (cell.line in cell.lines) {
  biomarkers.perf.res.random =
    add_row_to_ternary_df(df = biomarkers.perf.res.random,
                          values.pos = random.mcc.analysis.res[[cell.line]][["biomarkers.mcc.active"]],
                          values.neg = random.mcc.analysis.res[[cell.line]][["biomarkers.mcc.inhibited"]],
                          row.name = cell.line)
}

# Combine results
biomarkers.perf.res = as.data.frame(matrix(data = NA, nrow = 0, ncol = length(node.names)))
colnames(biomarkers.perf.res) = node.names

count = 0
for (cell.line in cell.lines) {
  for (node.name in node.names) {
    cell.spec.value = biomarkers.perf.res.cell.specific[cell.line, node.name]
    random.value    = biomarkers.perf.res.random[cell.line, node.name]
    diff = cell.spec.value - random.value
    if (diff != 2)
      biomarkers.perf.res[cell.line, node.name] = cell.spec.value + random.value
    else # diff == 2, e.g. (1 vs -1) or (-1 vs 1)
      {
        biomarkers.perf.res[cell.line, node.name] = random.value
        count = count + 1
      }
    }
  }

# remove nodes which are not biomarkers for any cell line
biomarkers.perf.res = prune_columns_from_df(biomarkers.perf.res, value = 0)
Note that when a performance biomarker was found at the same state (active or inhibited) in both the random and the cell-specific analyses, a value of \(2\) or \(-2\) respectively was kept in the final result. If a biomarker was reported as active/inhibited by one analysis but not as a biomarker in the other, we keep it as a biomarker nonetheless in the state specified in one of the two analyses. Lastly, if the results are complete opposites - meaning that a common biomarker was found for a cell line in different states in the two analyses (we have 4 cases only of this), we keep the state of that biomarker as it is reported by the cell-specific analysis (which was a bit more subtle and elaborate).
# define a coloring
biomarkers.col.fun = colorRamp2(c(-2,-1, 0, 1,2),
                                c("red", "tomato", "grey", "gold", "yellow"))

perf.biomarkers.heatmap =
  Heatmap(matrix = as.matrix(biomarkers.perf.res), col = biomarkers.col.fun,
        column_title = "Performance biomarkers per cell line",
        column_title_gp = gpar(fontsize = 20),
        row_title = "Cell Lines", row_title_side = "left",
        row_dend_side = "right", row_names_side = "left",
        column_names_gp = gpar(fontsize = 5),
        rect_gp = gpar(col = "black", lwd = 0.3),
        heatmap_legend_param = list(at = c(-2, -1, 1, 2), title = "Activity State",
          labels = c("Inhibited (Cell-specific+Random)", "Inhibited", "Active",
                     "Active (Cell-specific+Random)"),
          color_bar = "discrete", ncol = 2, title_position = "leftcenter",
          direction = "horizontal"))

draw(perf.biomarkers.heatmap, heatmap_legend_side = "bottom")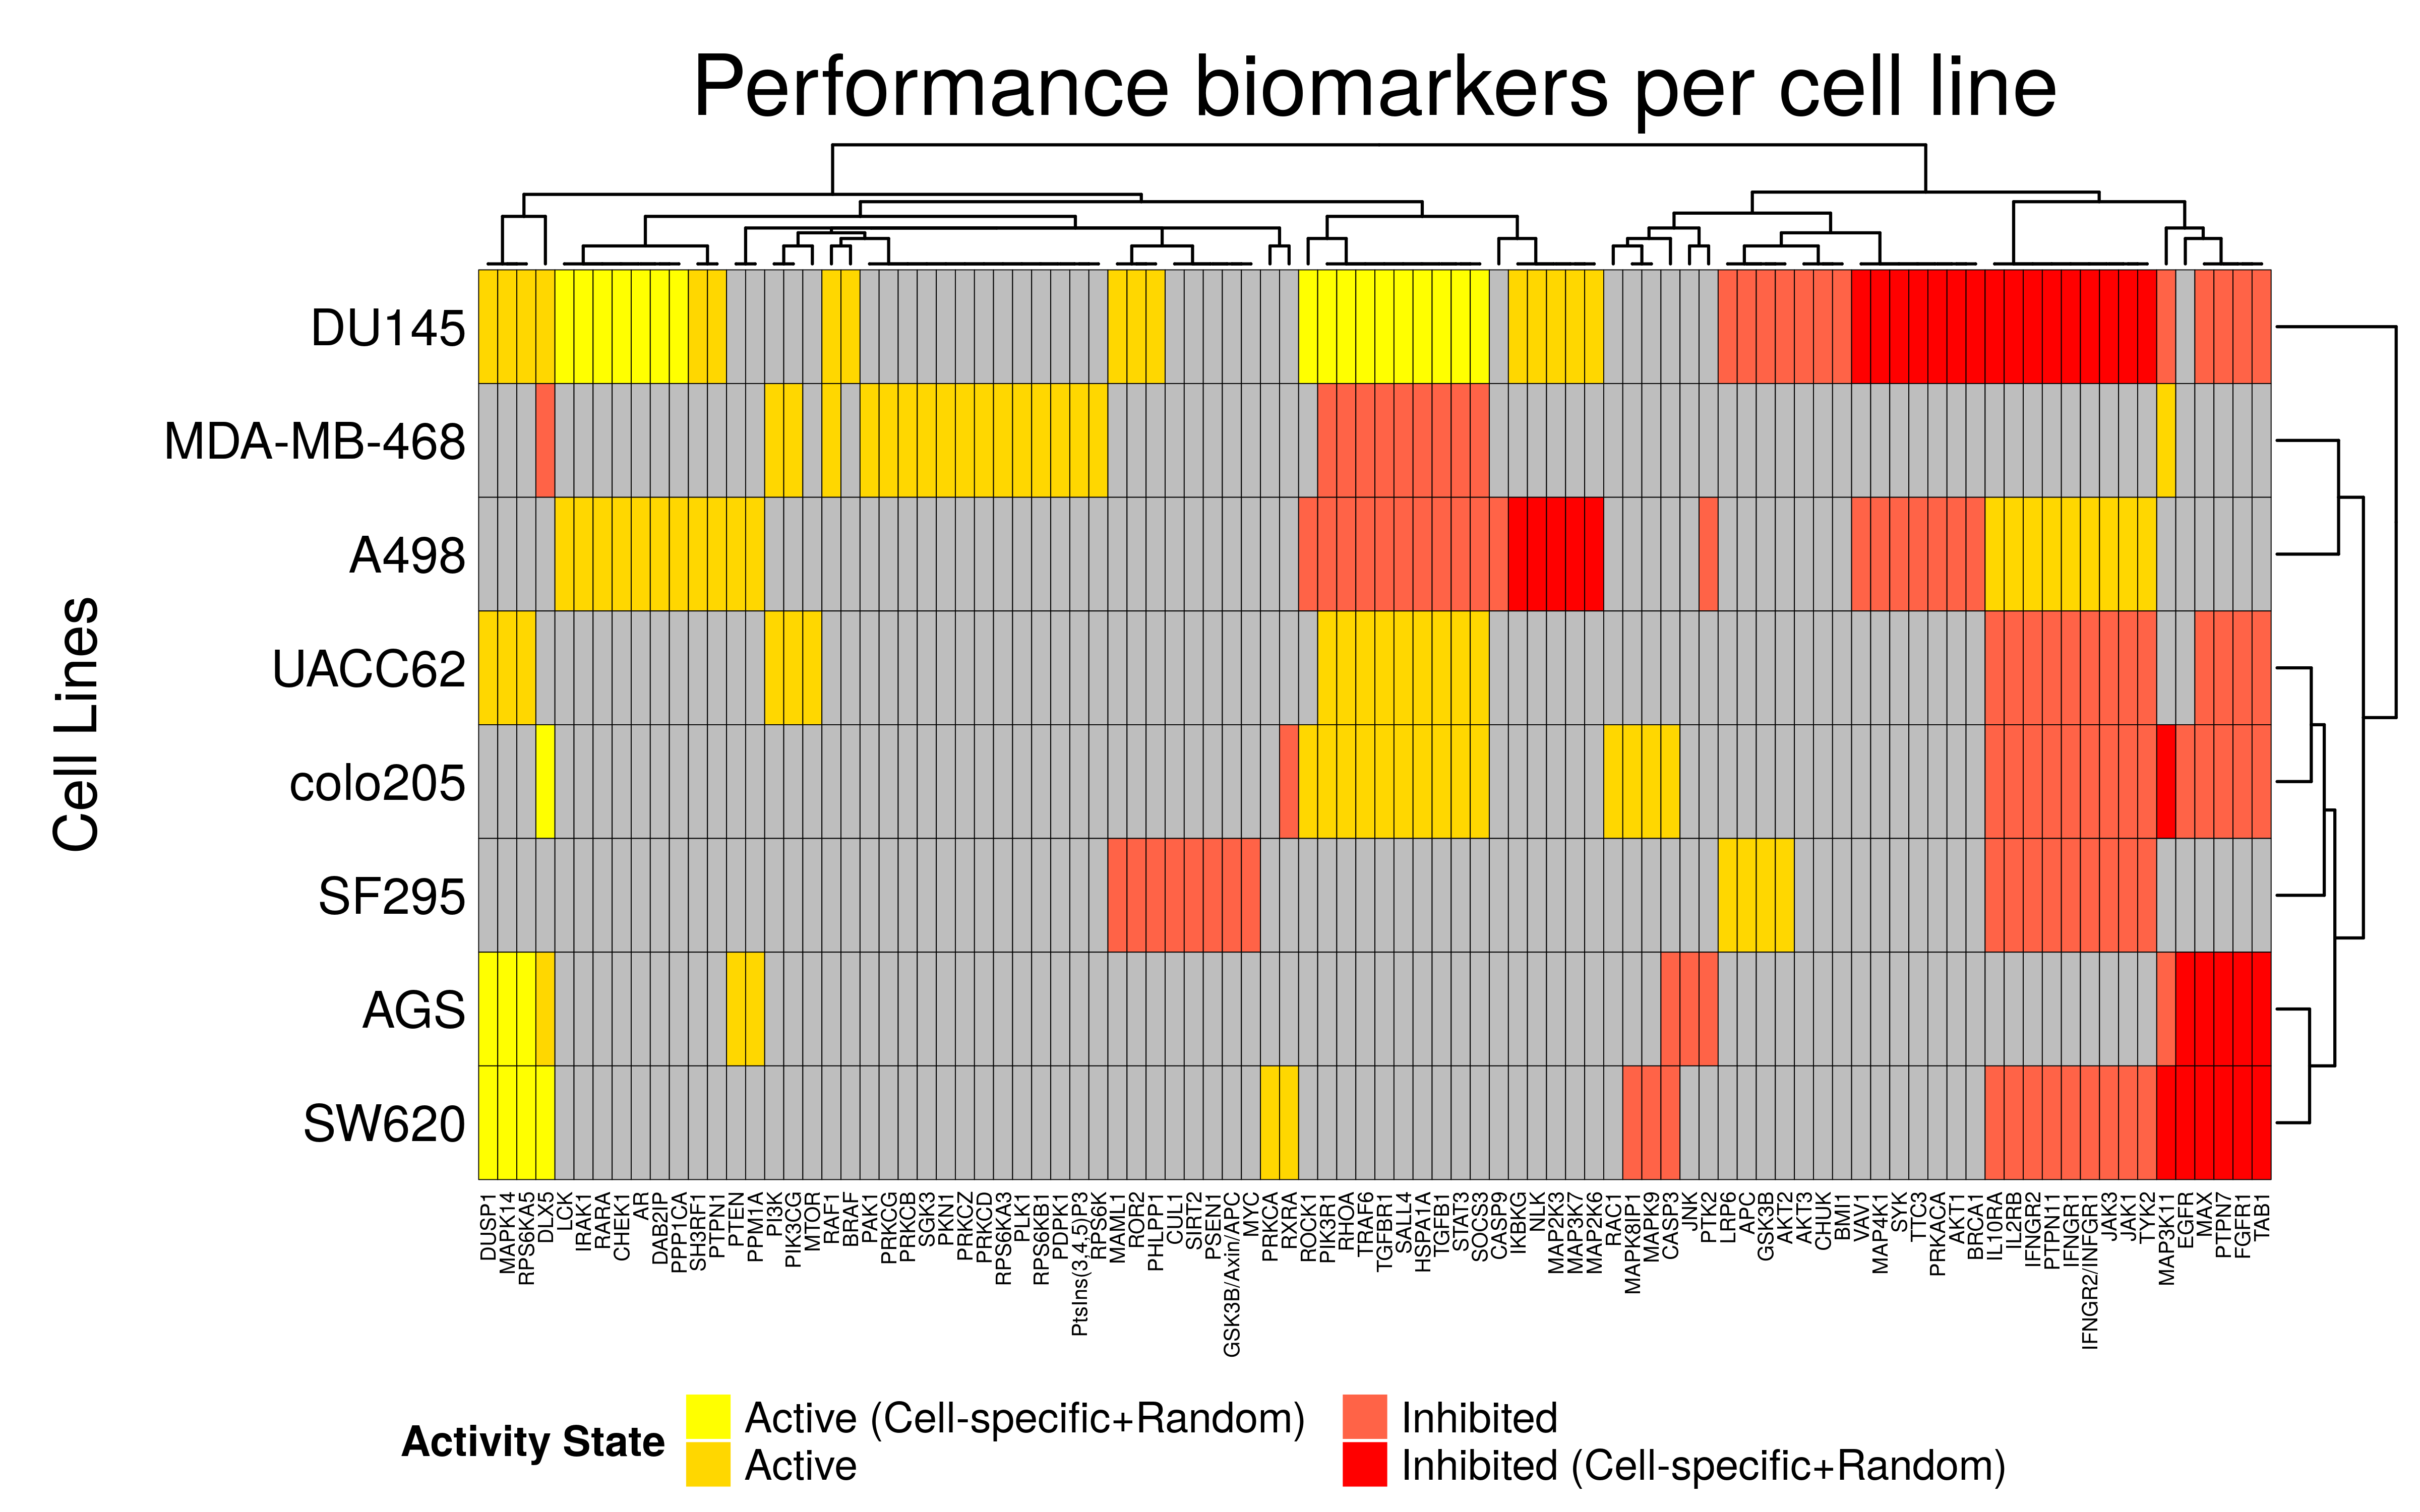
- Across all cell lines, a total of 94 performance biomarkers were found
- The three gastrointestinal cell lines (
AGS,SW620,colo205) have a lot of common biomarkers. These common biomarkers between the cell lines can be in either the same activity state (SW620vsAGS) or the reverse (SW620vscolo205) - In general the biomarker results are different between the different type of cell lines
- There exist unique biomarkers per cell line which are not shared with any of the other cell lines
We save the cell-specific and random model analysis results separately:
Observed synergies
Each of the cell lines studied has a different set of observed synergies (drug combinations that were found synergistic across all the 153 tested ones). In this section, we will visualize the cell lines’ observed synergies and mark the synergies that were also predicted by the cell-specific models and the random-generated ones. First, we get the biomarkers for these synergies from each cell line:
synergy.biomarkers.cell.specific =
  get_synergy_biomarkers_per_cell_line(biomarkers.dirs)

total.predicted.synergies.cell.specific =
  unique(unlist(sapply(synergy.biomarkers.cell.specific, function(df) { rownames(df) })))
total.predicted.synergies.cell.specific.num =
  length(total.predicted.synergies.cell.specific)
The same for the random models:
synergy.biomarkers.random =
  sapply(cell.lines, function(cell.line) {
    random.synergy.analysis.res[[cell.line]][['activity.biomarkers']]
  }, simplify = FALSE)

total.predicted.synergies.random =
  unique(unlist(sapply(synergy.biomarkers.random, function(df) { rownames(df) })))
total.predicted.synergies.random.num = length(total.predicted.synergies.random)
Then, we get the observed synergies from each cell line:
observed.synergies.res = get_observed_synergies_per_cell_line(cell.line.dirs, drug.combos)

# remove drug combinations which are not observed in any of the cell lines
observed.synergies.res = prune_columns_from_df(observed.synergies.res, value = 0)

total.observed.synergies = colnames(observed.synergies.res)
total.observed.synergies.num = length(total.observed.synergies)
Lastly, we visualize the observed and predicted synergies for all cell lines in one heatmap:
# color the cell-specific predicted synergies
predicted.synergies.colors = rep("black", total.observed.synergies.num)
names(predicted.synergies.colors) = total.observed.synergies
common.predicted.synergies = intersect(total.predicted.synergies.cell.specific,
                                       total.predicted.synergies.random)
cell.specific.only.predicted.synergies =
  total.predicted.synergies.cell.specific[!total.predicted.synergies.cell.specific %in% total.predicted.synergies.random]
random.only.predicted.synergies =
  total.predicted.synergies.random[!total.predicted.synergies.random %in% total.predicted.synergies.cell.specific]

predicted.synergies.colors[total.observed.synergies %in%
                           common.predicted.synergies] = "blue"
predicted.synergies.colors[total.observed.synergies %in%
                           cell.specific.only.predicted.synergies] = "orange"
predicted.synergies.colors[total.observed.synergies %in%
                           random.only.predicted.synergies] = "purple"

# define a coloring
obs.synergies.col.fun = colorRamp2(c(0, 1), c("red", "green"))

observed.synergies.heatmap =
  Heatmap(matrix = as.matrix(observed.synergies.res),
          col = obs.synergies.col.fun,
          column_title = "Observed synergies per cell line",
          column_title_gp = gpar(fontsize = 20),
          column_names_gp = gpar(col = predicted.synergies.colors),
          row_title = "Cell Lines", row_title_side = "left",
          row_dend_side = "right", row_names_side = "left",
          rect_gp = gpar(col = "black", lwd = 0.3),
          heatmap_legend_param = list(at = c(1, 0), labels = c("YES", "NO"),
            color_bar = "discrete", title = "Observed", direction = "vertical"))

lgd = Legend(at = c("Cell-specific", "Random", "Both"), title = "Predicted",
             legend_gp = gpar(fill = c("orange", "purple", "blue")))

draw(observed.synergies.heatmap,  heatmap_legend_list = list(lgd),
     heatmap_legend_side = "right")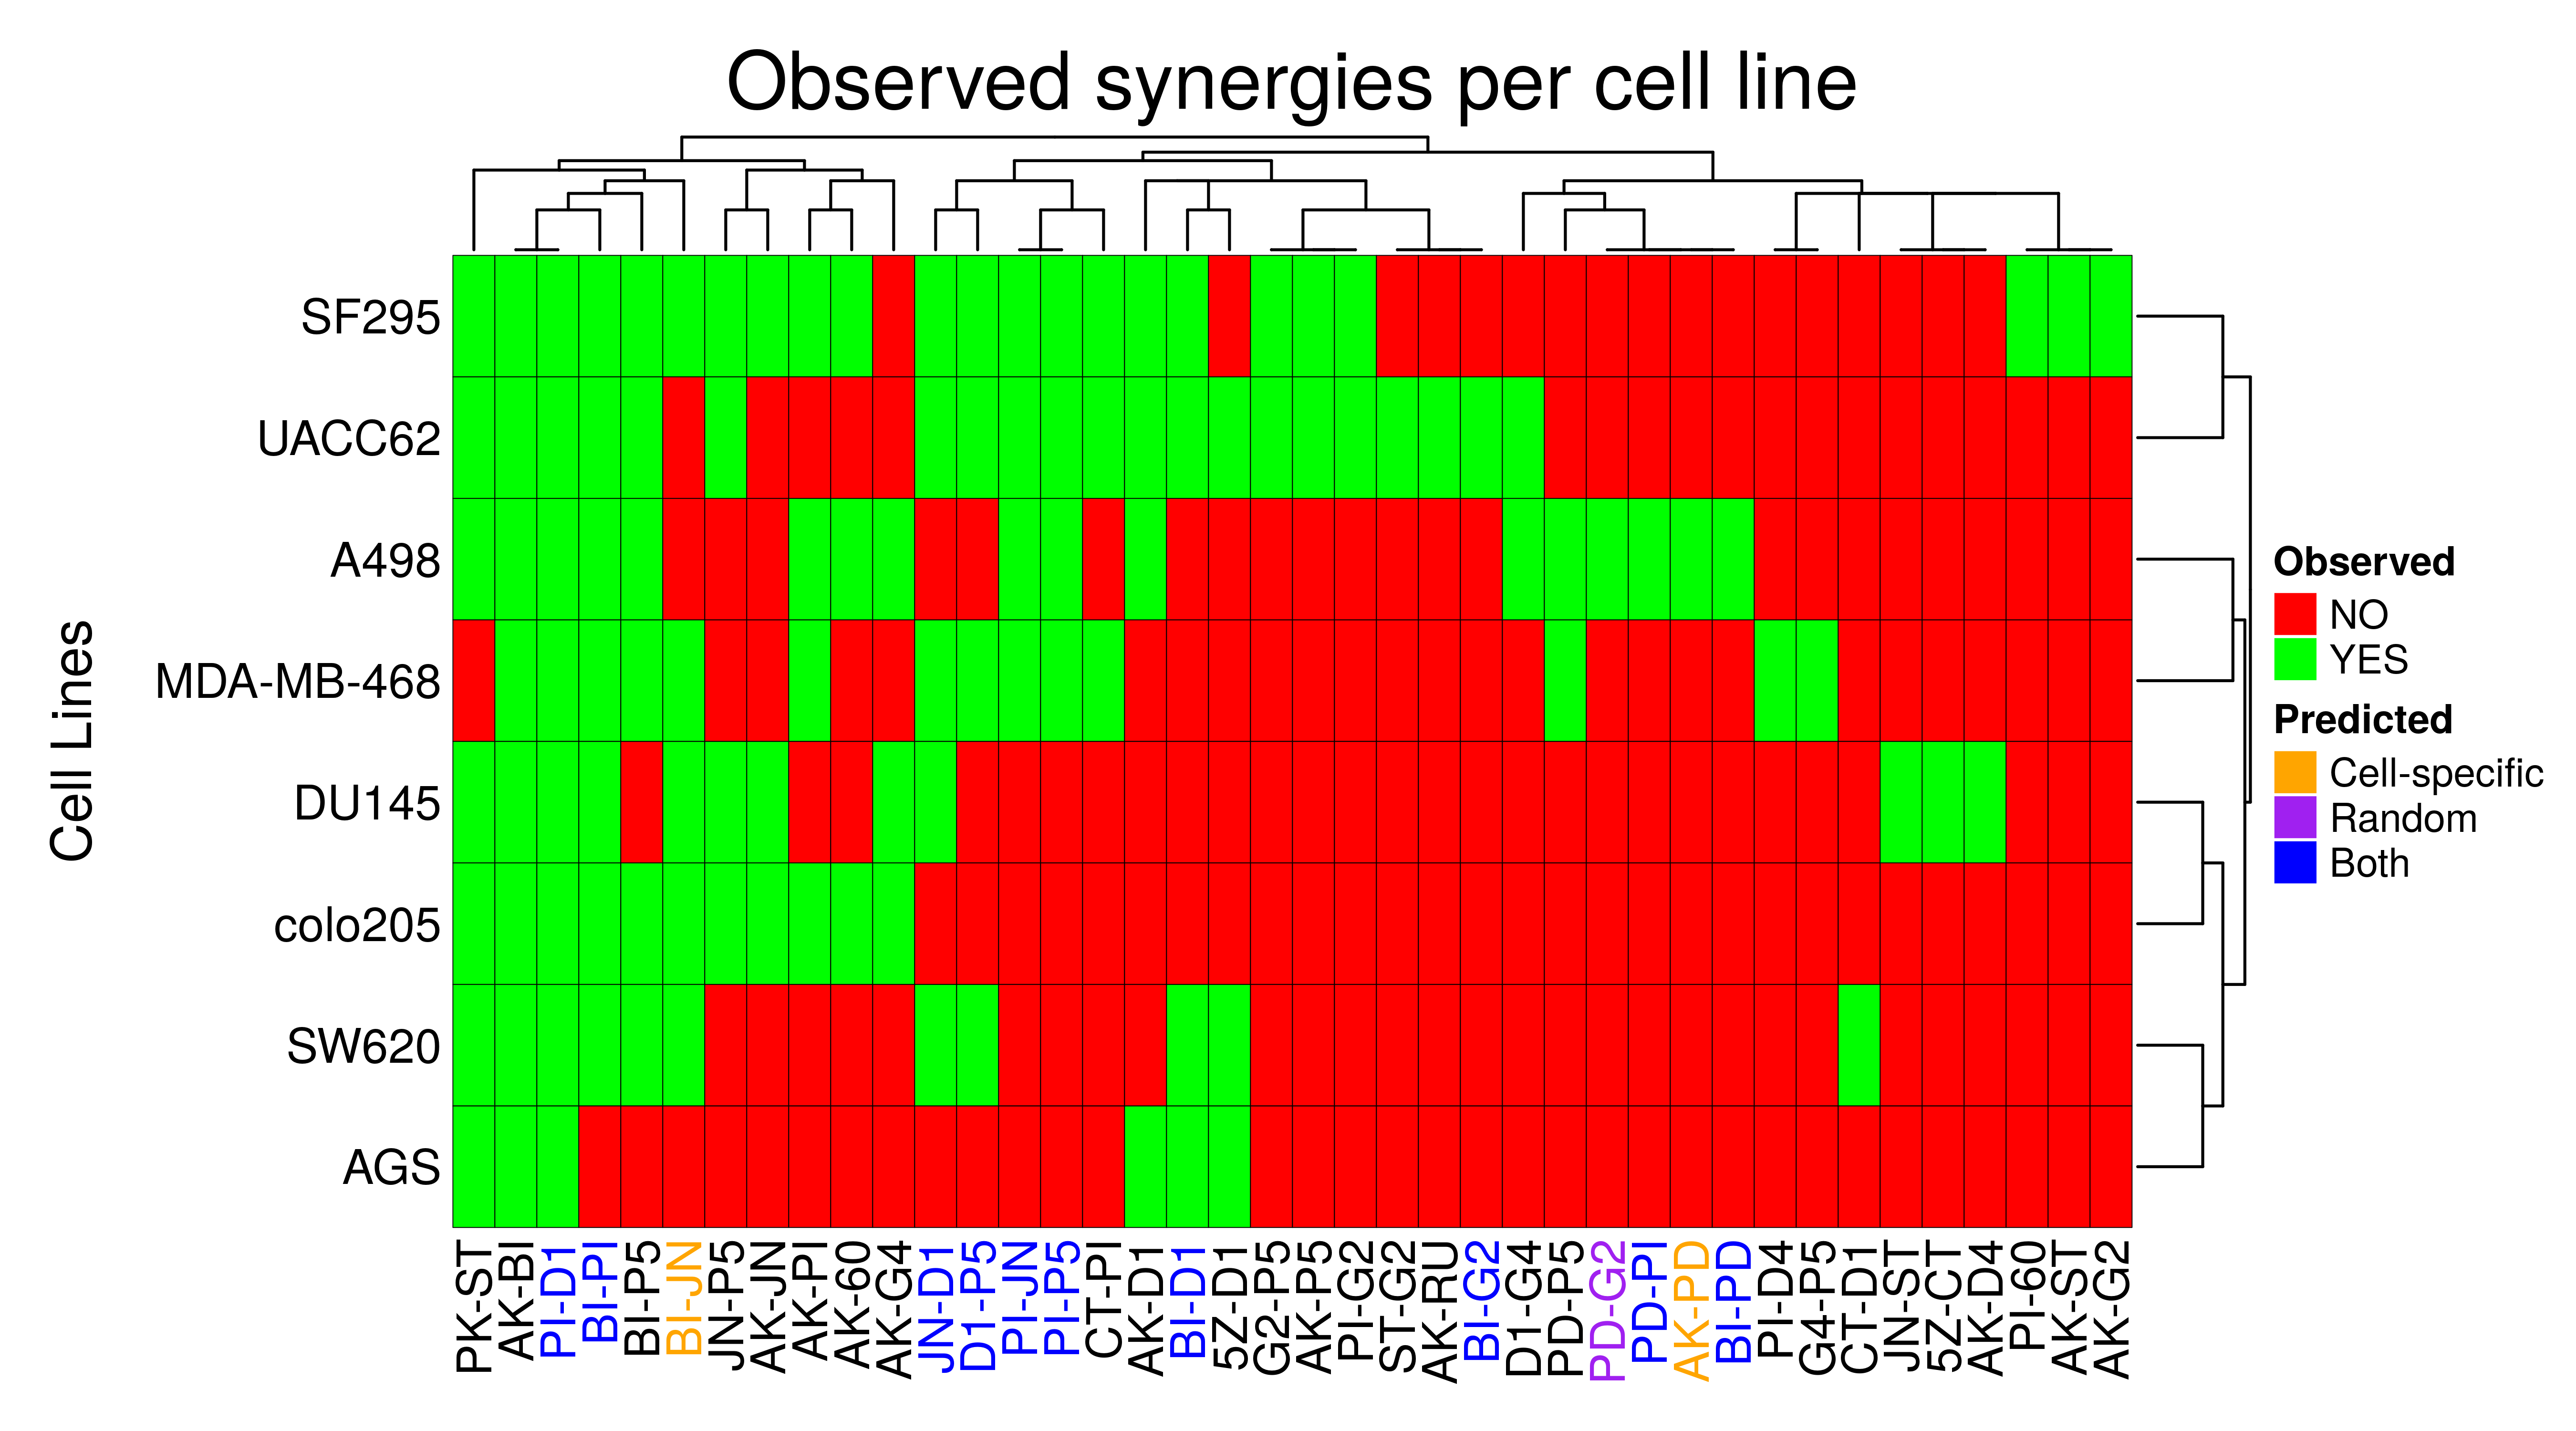
- The cell-specific models predicted 12 of the 40 observed synergies found across the 8 cell lines, whereas the random models predicted 11 of them. Thus, the total true positive coverage for all the models across all cell lines is 32.5%
- Note that there exist synergies which were observed in all cell lines (
AK-BI,PI-D1) BI-JNis an observed synergy across almost all cell lines and only the cell-specific models could predict it.- The synergies
PD-G2andAK-PDin theA498cell line were identified only by the random and cell-specific models respectively (and these synergies were observed in no other cell line). This shows us that a complimentary approach is needed when searching for biomarkers as the two different kind of models (trained to a specific activity state profile vs trained to proliferation) although they share common true positives regarding the synergies they predict, there are also synergies only a specific class of models could predict.
Synergy Biomarkers
In this section, we will produce heatmaps showing the biomarkers across the 8 cell lines for every observed synergy that was also predicted by the cell-specific and/or random models. First, we manipulate the biomarker result data to fit our purposes:
synergy.biomarkers.cell.specific.res = ldf_arrange_by_rownames(synergy.biomarkers.cell.specific)
synergy.biomarkers.random.res = ldf_arrange_by_rownames(synergy.biomarkers.random)
synergy.biomarkers.res = synergy.biomarkers.cell.specific.res
for (synergy in names(synergy.biomarkers.random.res)) {
df = synergy.biomarkers.random.res[[synergy]]
if (!is.null(df) && ncol(df) > 0) {
row.df = df[1, ] # models do not differ per cell line so biomarkers are the same for all rows
rownames(row.df) = "Random"
if (synergy %in% names(synergy.biomarkers.res)) {
synergy.biomarkers.res[[synergy]] =
rbind(synergy.biomarkers.res[[synergy]], row.df)
} else {
synergy.biomarkers.res[[synergy]] = row.df
}
}
}
# For every synergy, remove cell lines (or the Random-specific analysis results)
# that didn't predict the observed synergies at all or for which we couldn't
# find any biomarkers (row pruning).
# Also remove nodes which are not biomarkers for any cell line (column pruning)
for (synergy in names(synergy.biomarkers.res)) {
df = synergy.biomarkers.res[[synergy]]
df = prune_columns_from_df(df, value = 0)
df = prune_rows_from_df(df, value = 0)
synergy.biomarkers.res[[synergy]] = df
}
# re-order result list based on increasing number of rows (cell lines)
synergy.biomarkers.res = synergy.biomarkers.res[
names(sort(sapply(synergy.biomarkers.res, function(x) { nrow(x) })))
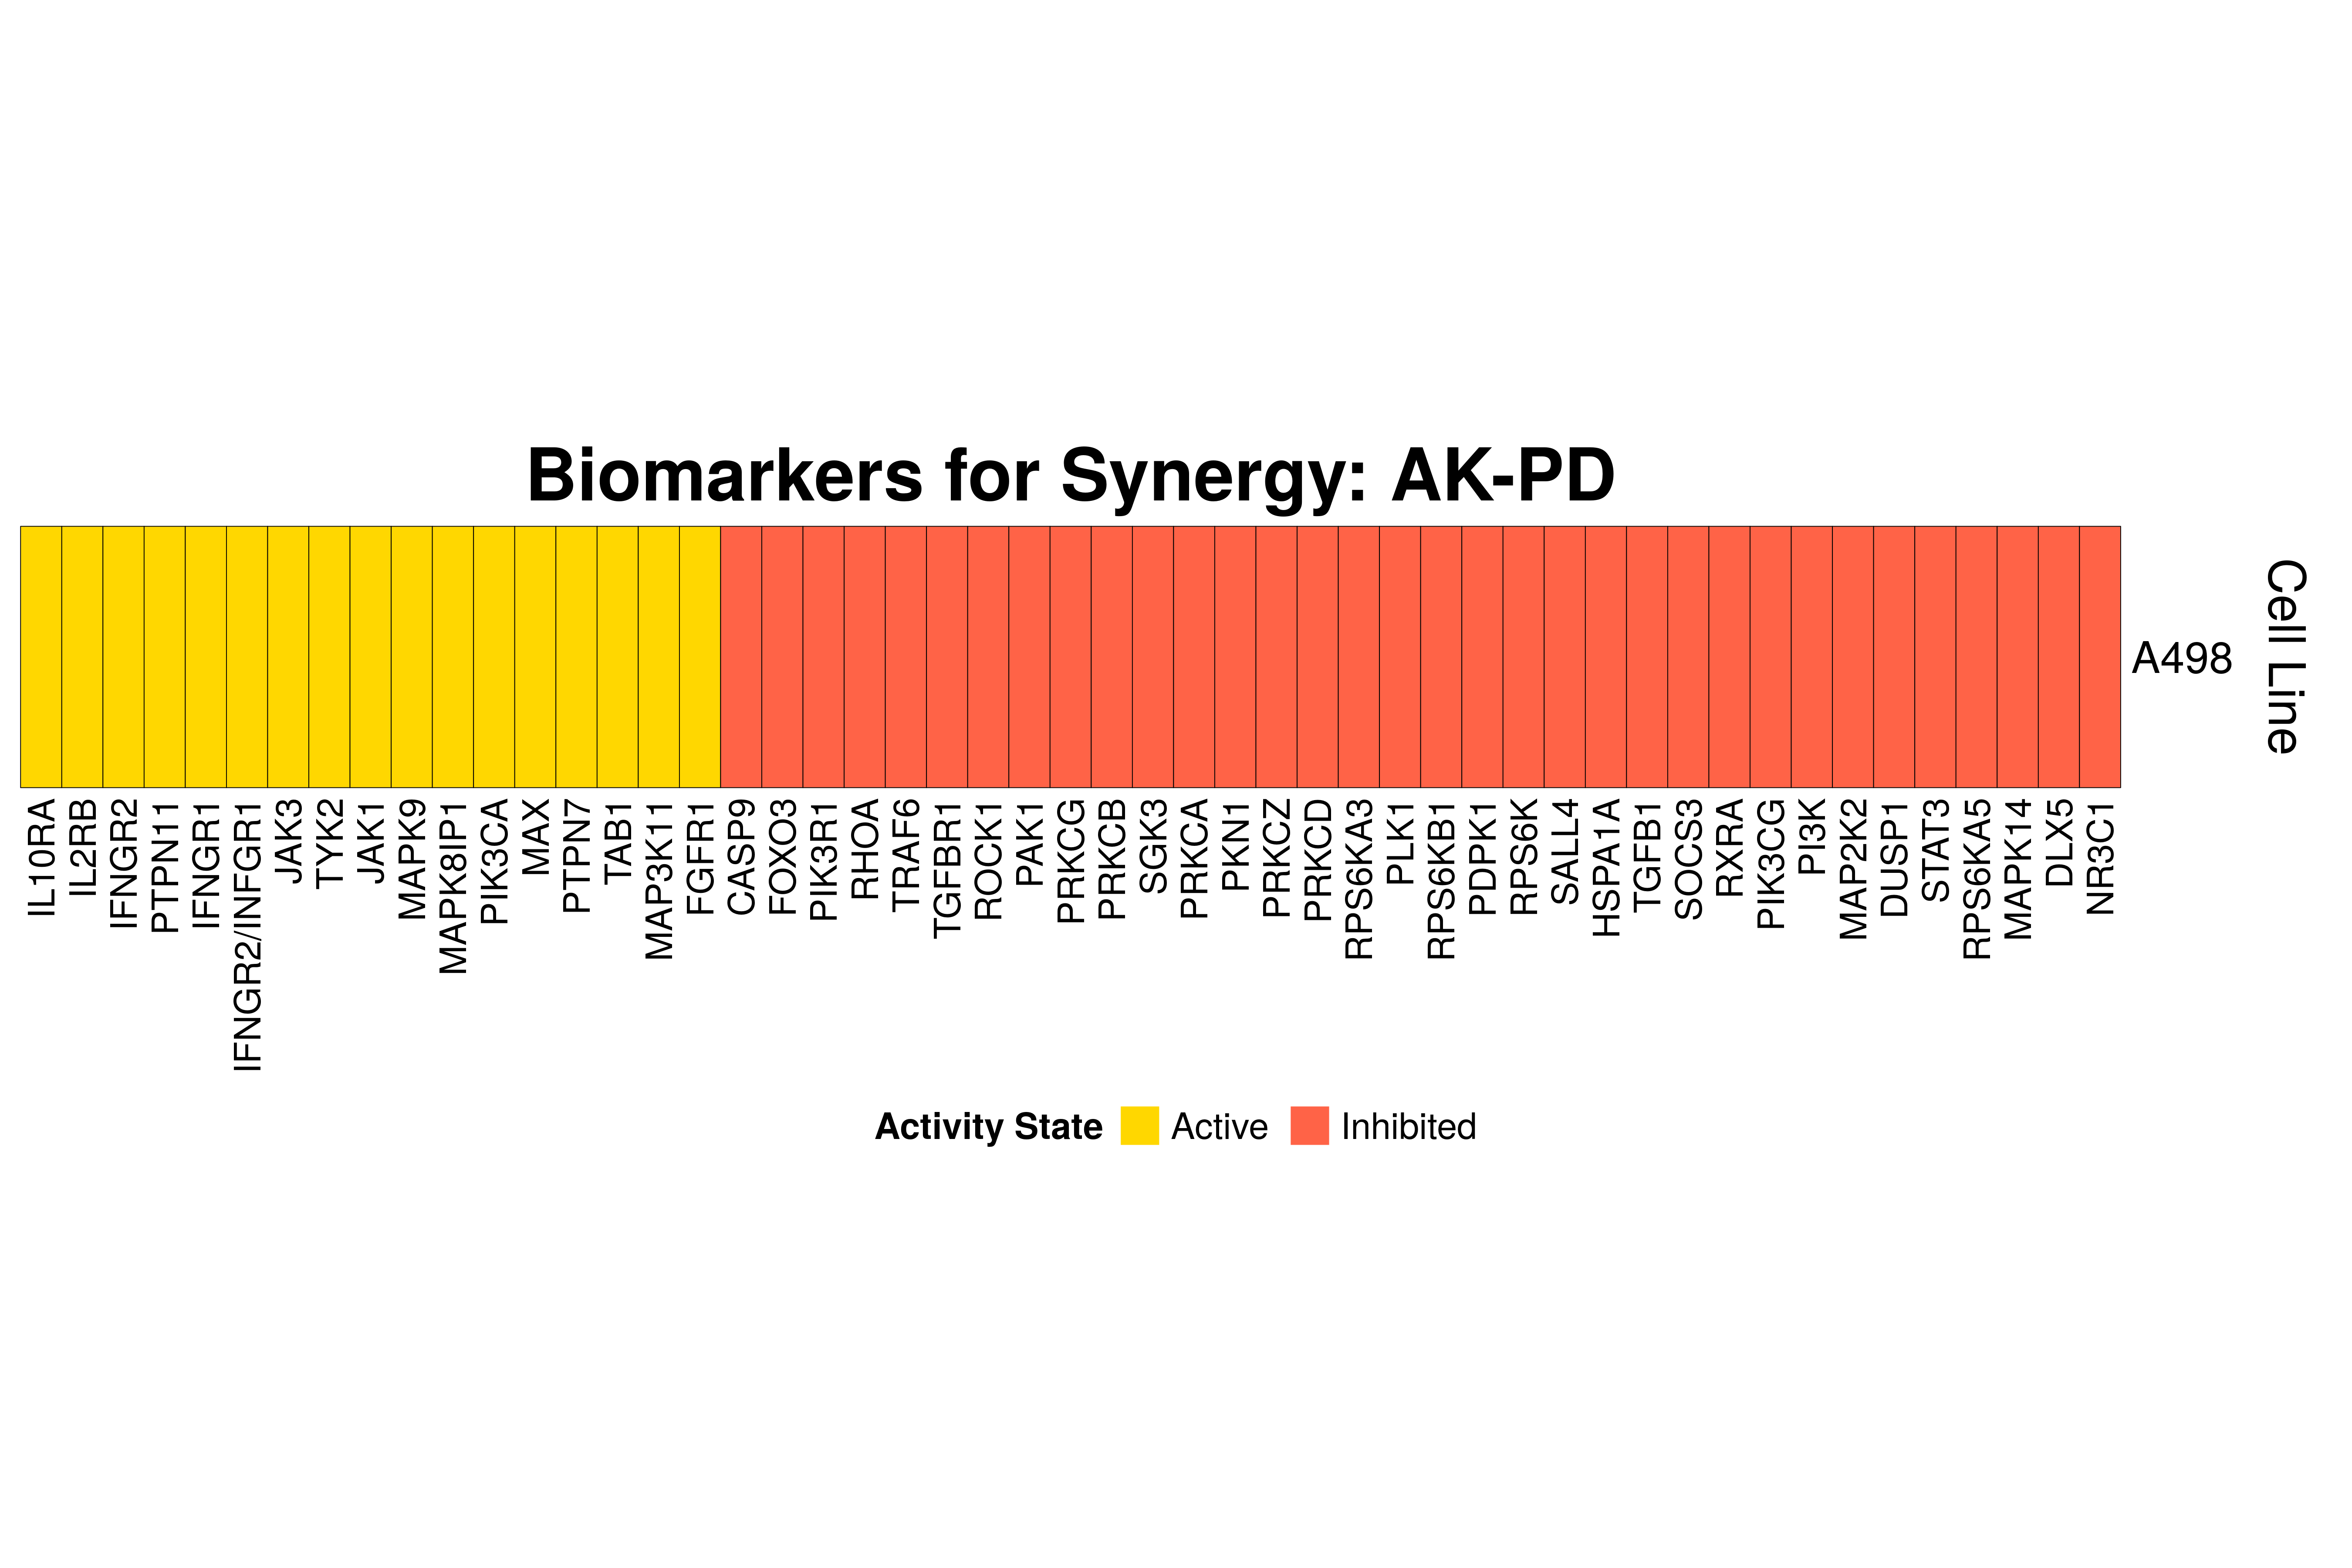
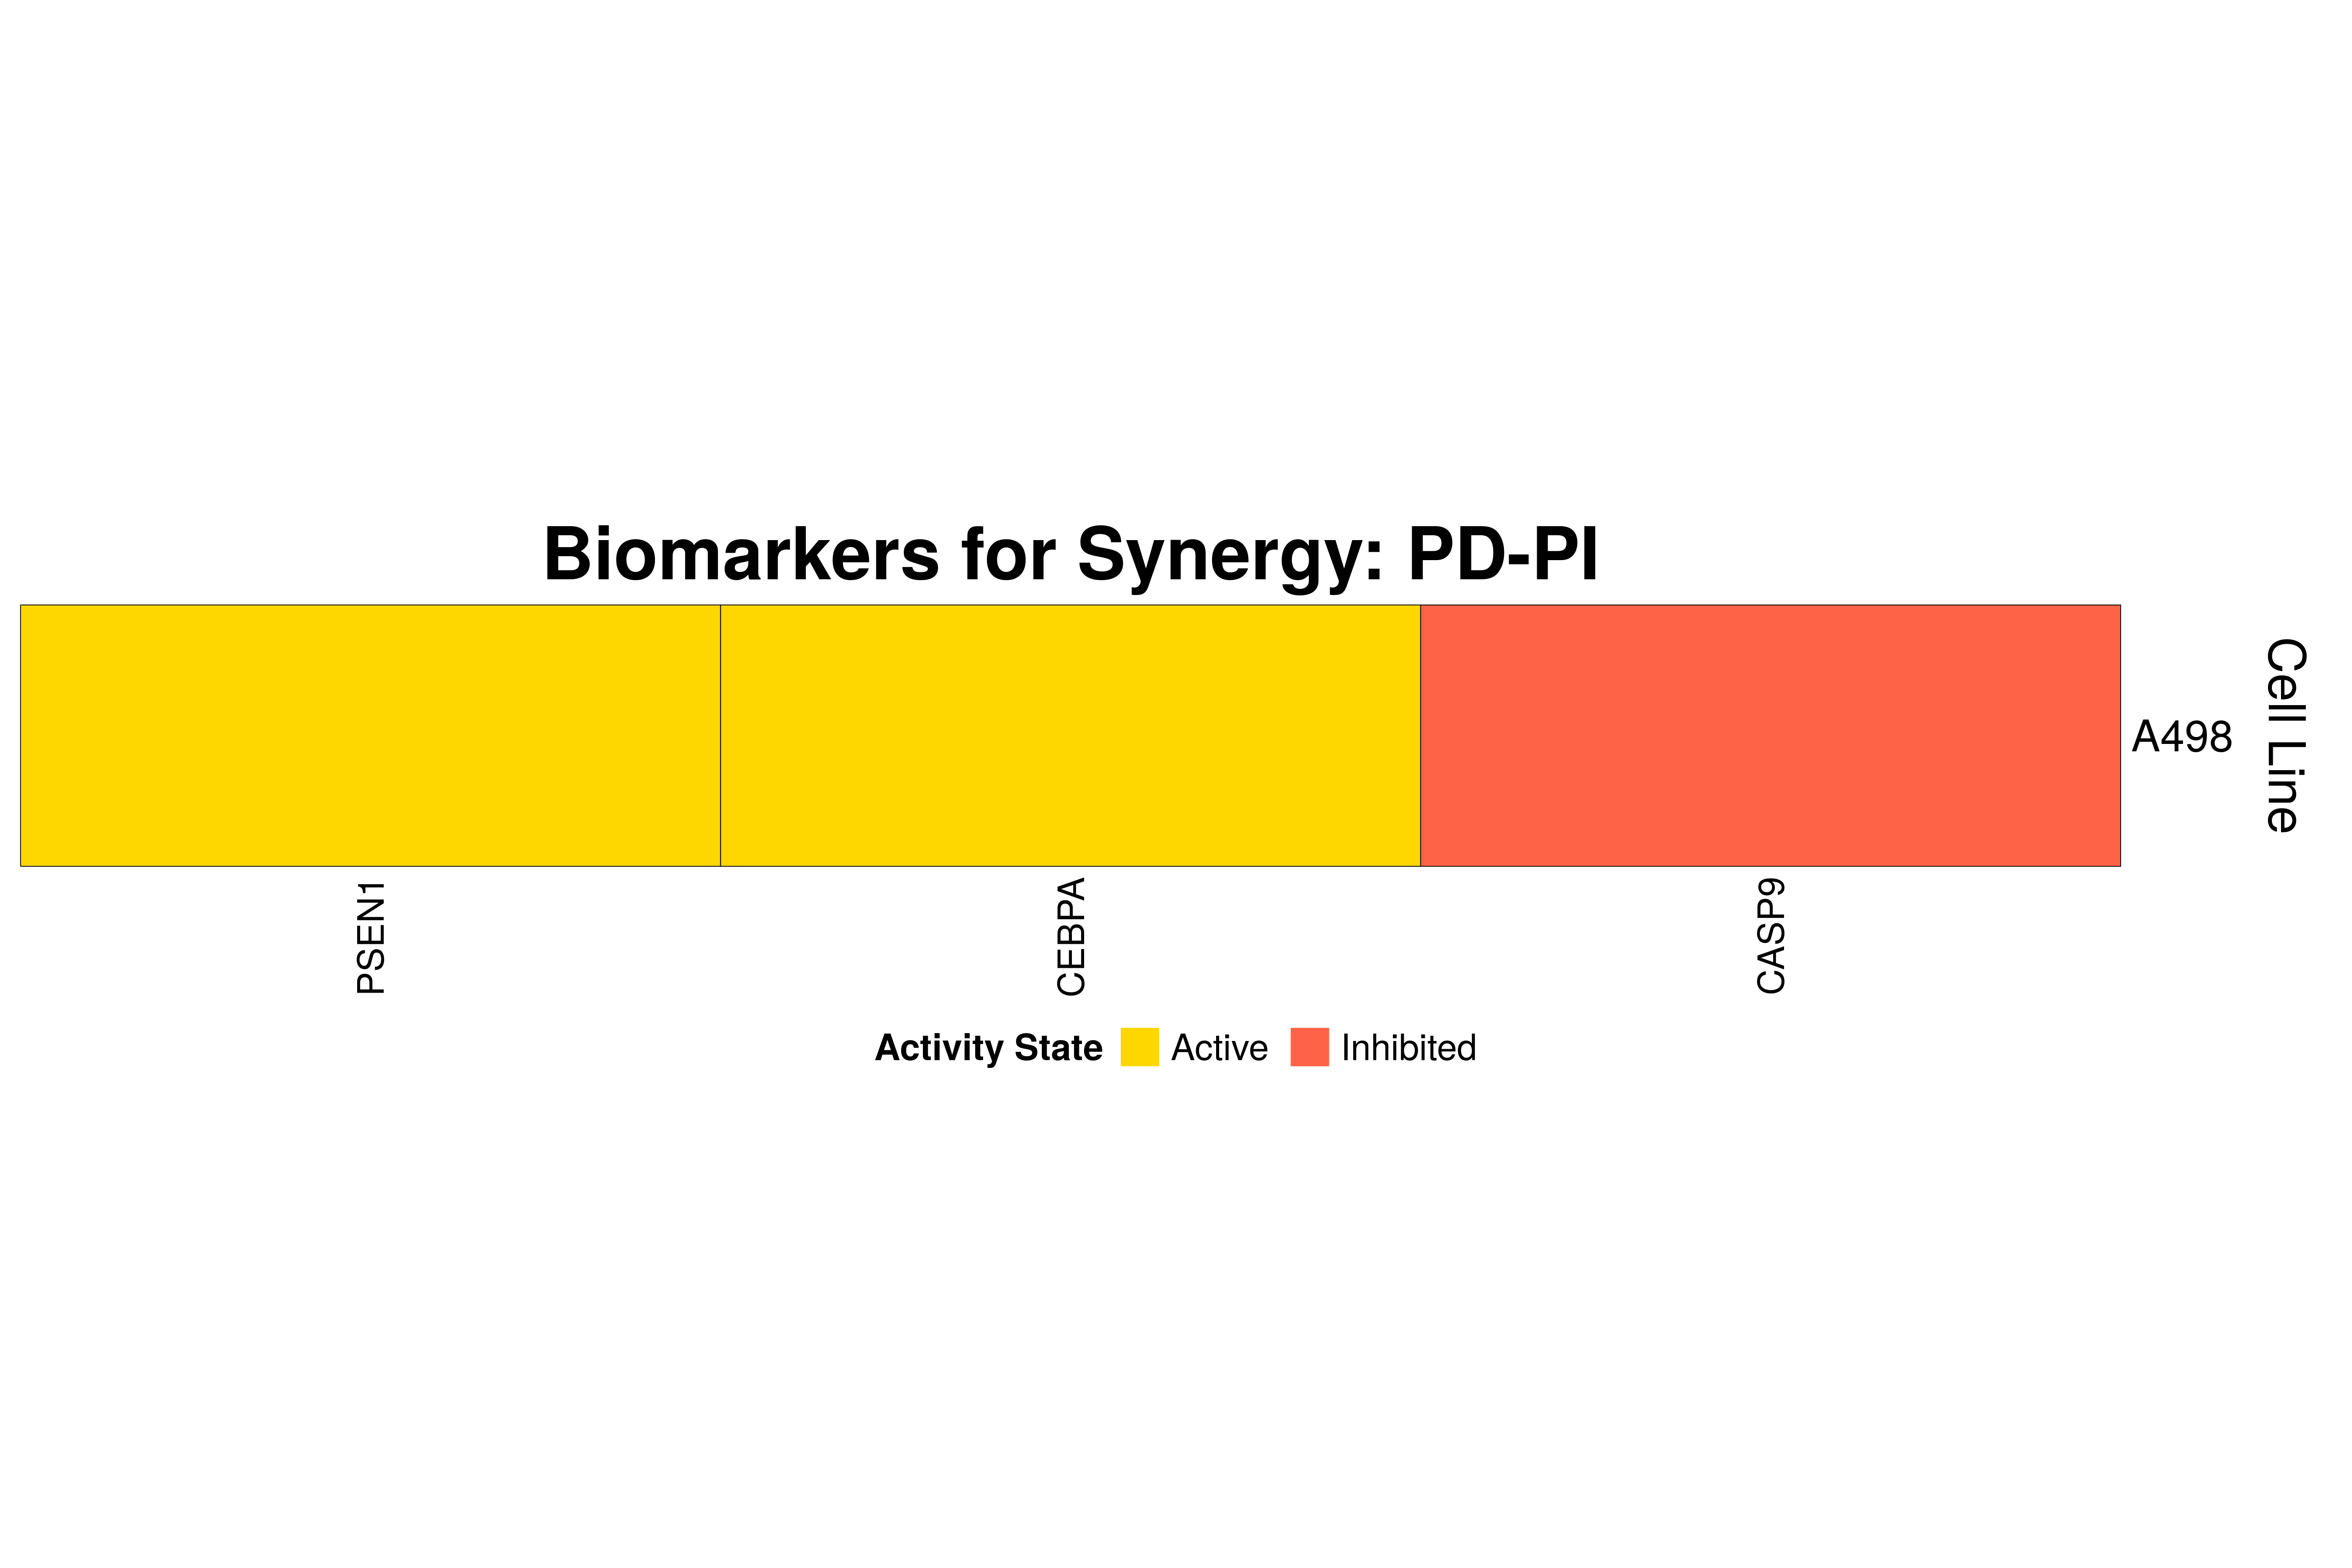
]Next, we produce the biomarker heatmaps (one per synergy predicted) found from
the cell-specific and/or random models. The synergy biomarkers found from the
random-models are not cell-line specific, so they are depicted as Random Cell
Lines/rows in the subsequent heatmaps. If the Random row is missing for a particular synergy, then
either the random models didn’t predicted it (AK-PD and BI-JN cases) or no
biomarkers were found (e.g. PD-PI). Also, note that in the case of the synergy
PD-G2 there are no cell line names because the cell-specific models didn’t
predict it (in any cell line).
for (synergy in names(synergy.biomarkers.res)) {
  biomarkers.res = as.matrix(synergy.biomarkers.res[[synergy]])

  # customize some parameters
  heatmap.height = ifelse(nrow(biomarkers.res) < 3, 1, 3)
  show.column.dend = ifelse(nrow(biomarkers.res) == 1, FALSE, TRUE)
  row.title = ifelse(nrow(biomarkers.res) == 1, "Cell Line", "Cell Lines")

  biomarkers.heatmap =
    Heatmap(matrix = biomarkers.res, col = biomarkers.col.fun,
          column_title = paste0("Biomarkers for Synergy: ", synergy),
          column_title_gp = gpar(fontsize = 20, fontface = "bold"),
          row_title = row.title, row_title_side = "right",
          rect_gp = gpar(col = "black", lwd = 0.3),
          column_names_gp = gpar(fontsize = 10),
          show_column_dend = show.column.dend,
          height = unit(heatmap.height, "inches"),
          heatmap_legend_param = list(at = c(-1, 1), title = "Activity State",
            labels = c("Inhibited", "Active"), color_bar = "discrete",
            title_position = "leftcenter", direction = "horizontal", ncol = 2))

  draw(biomarkers.heatmap, heatmap_legend_side = "bottom")
}
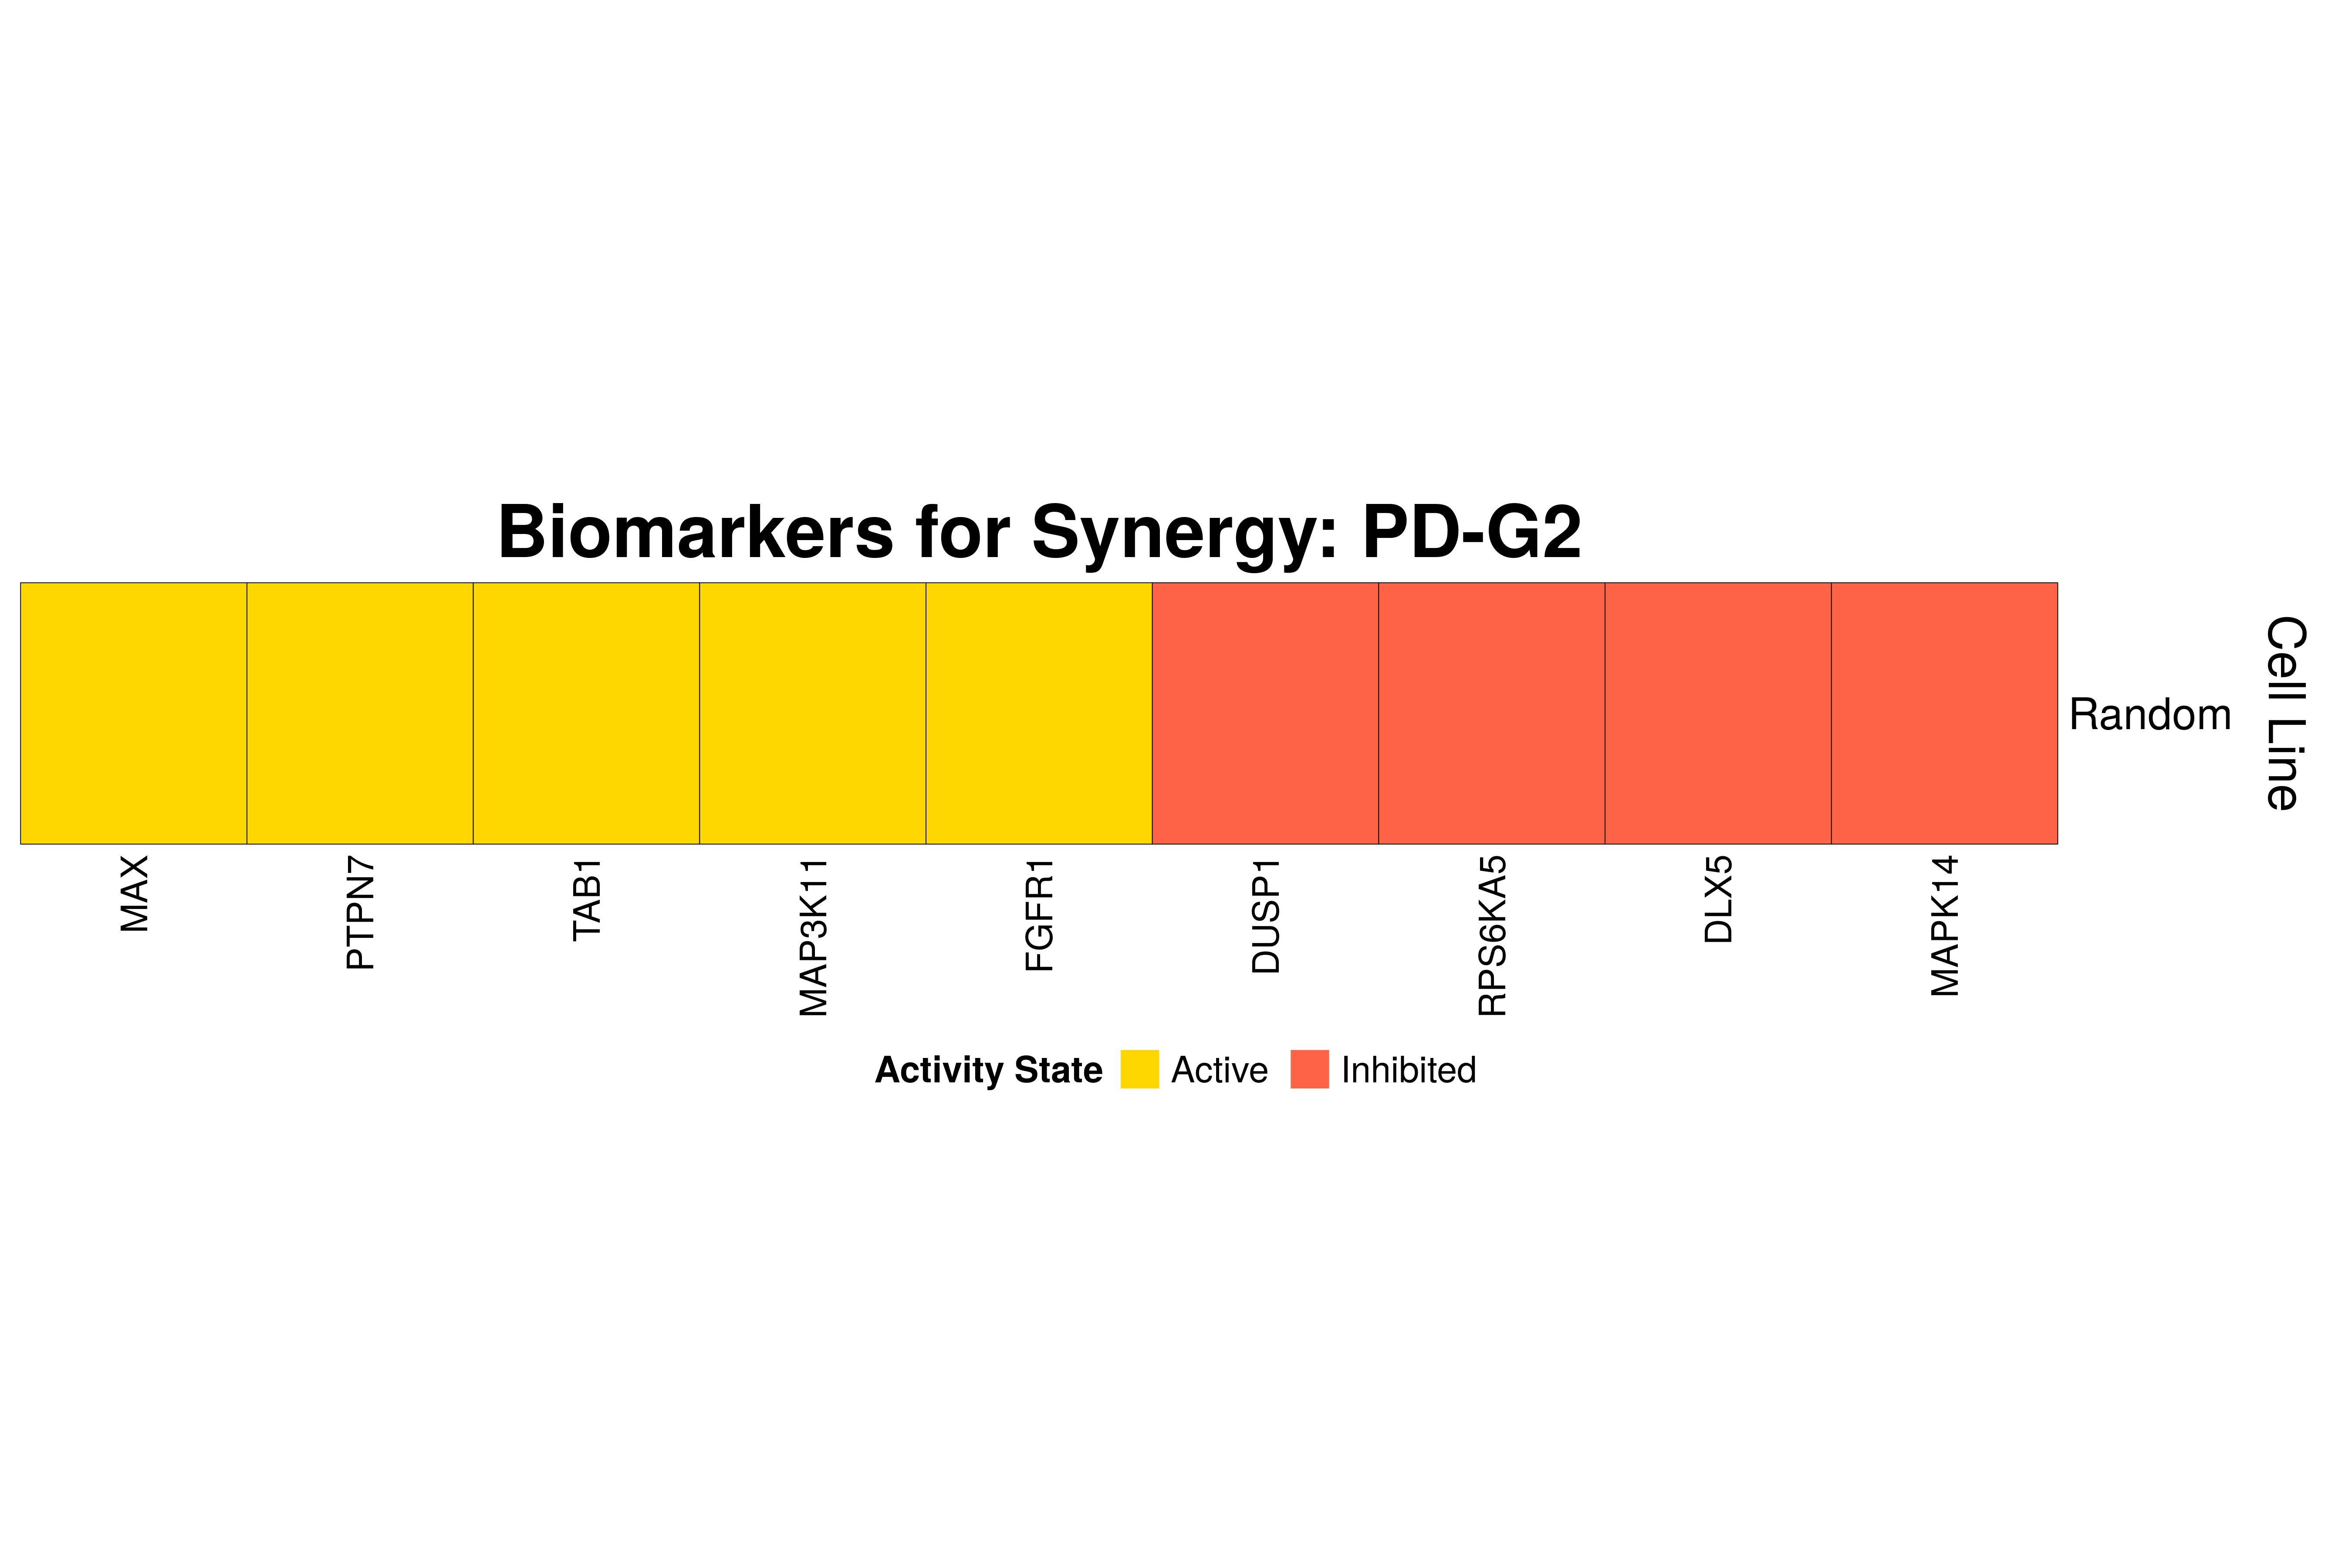
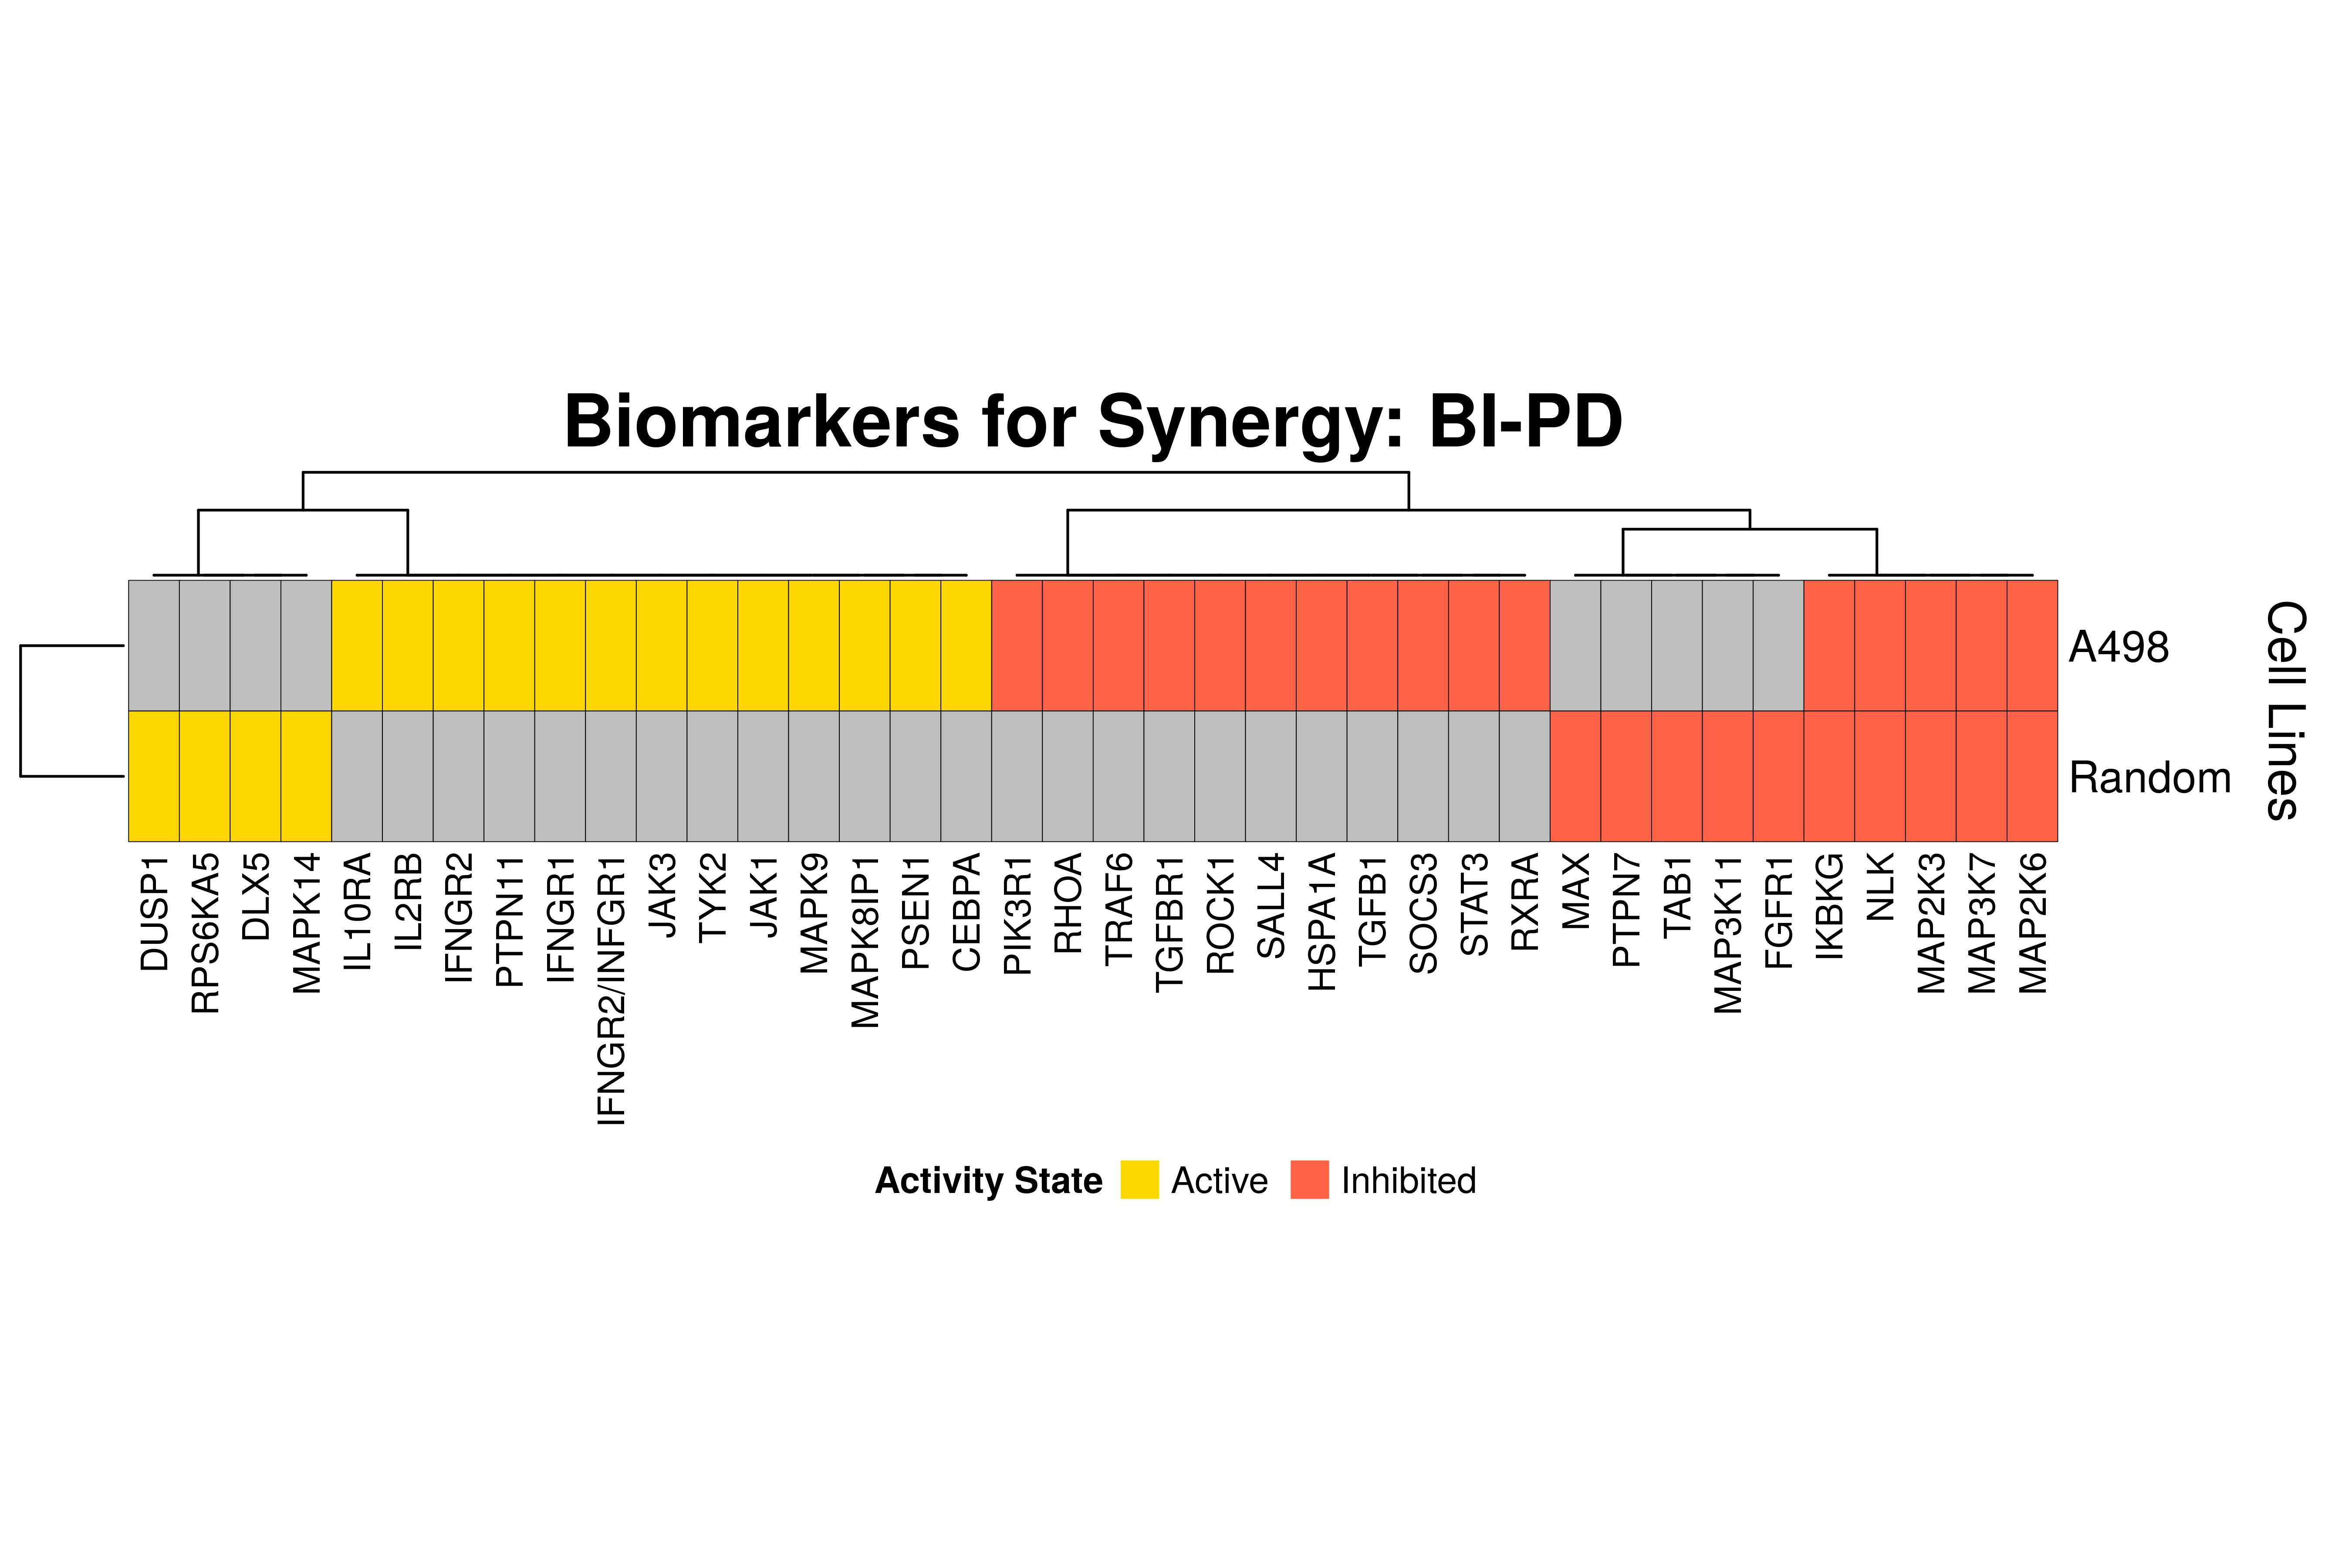
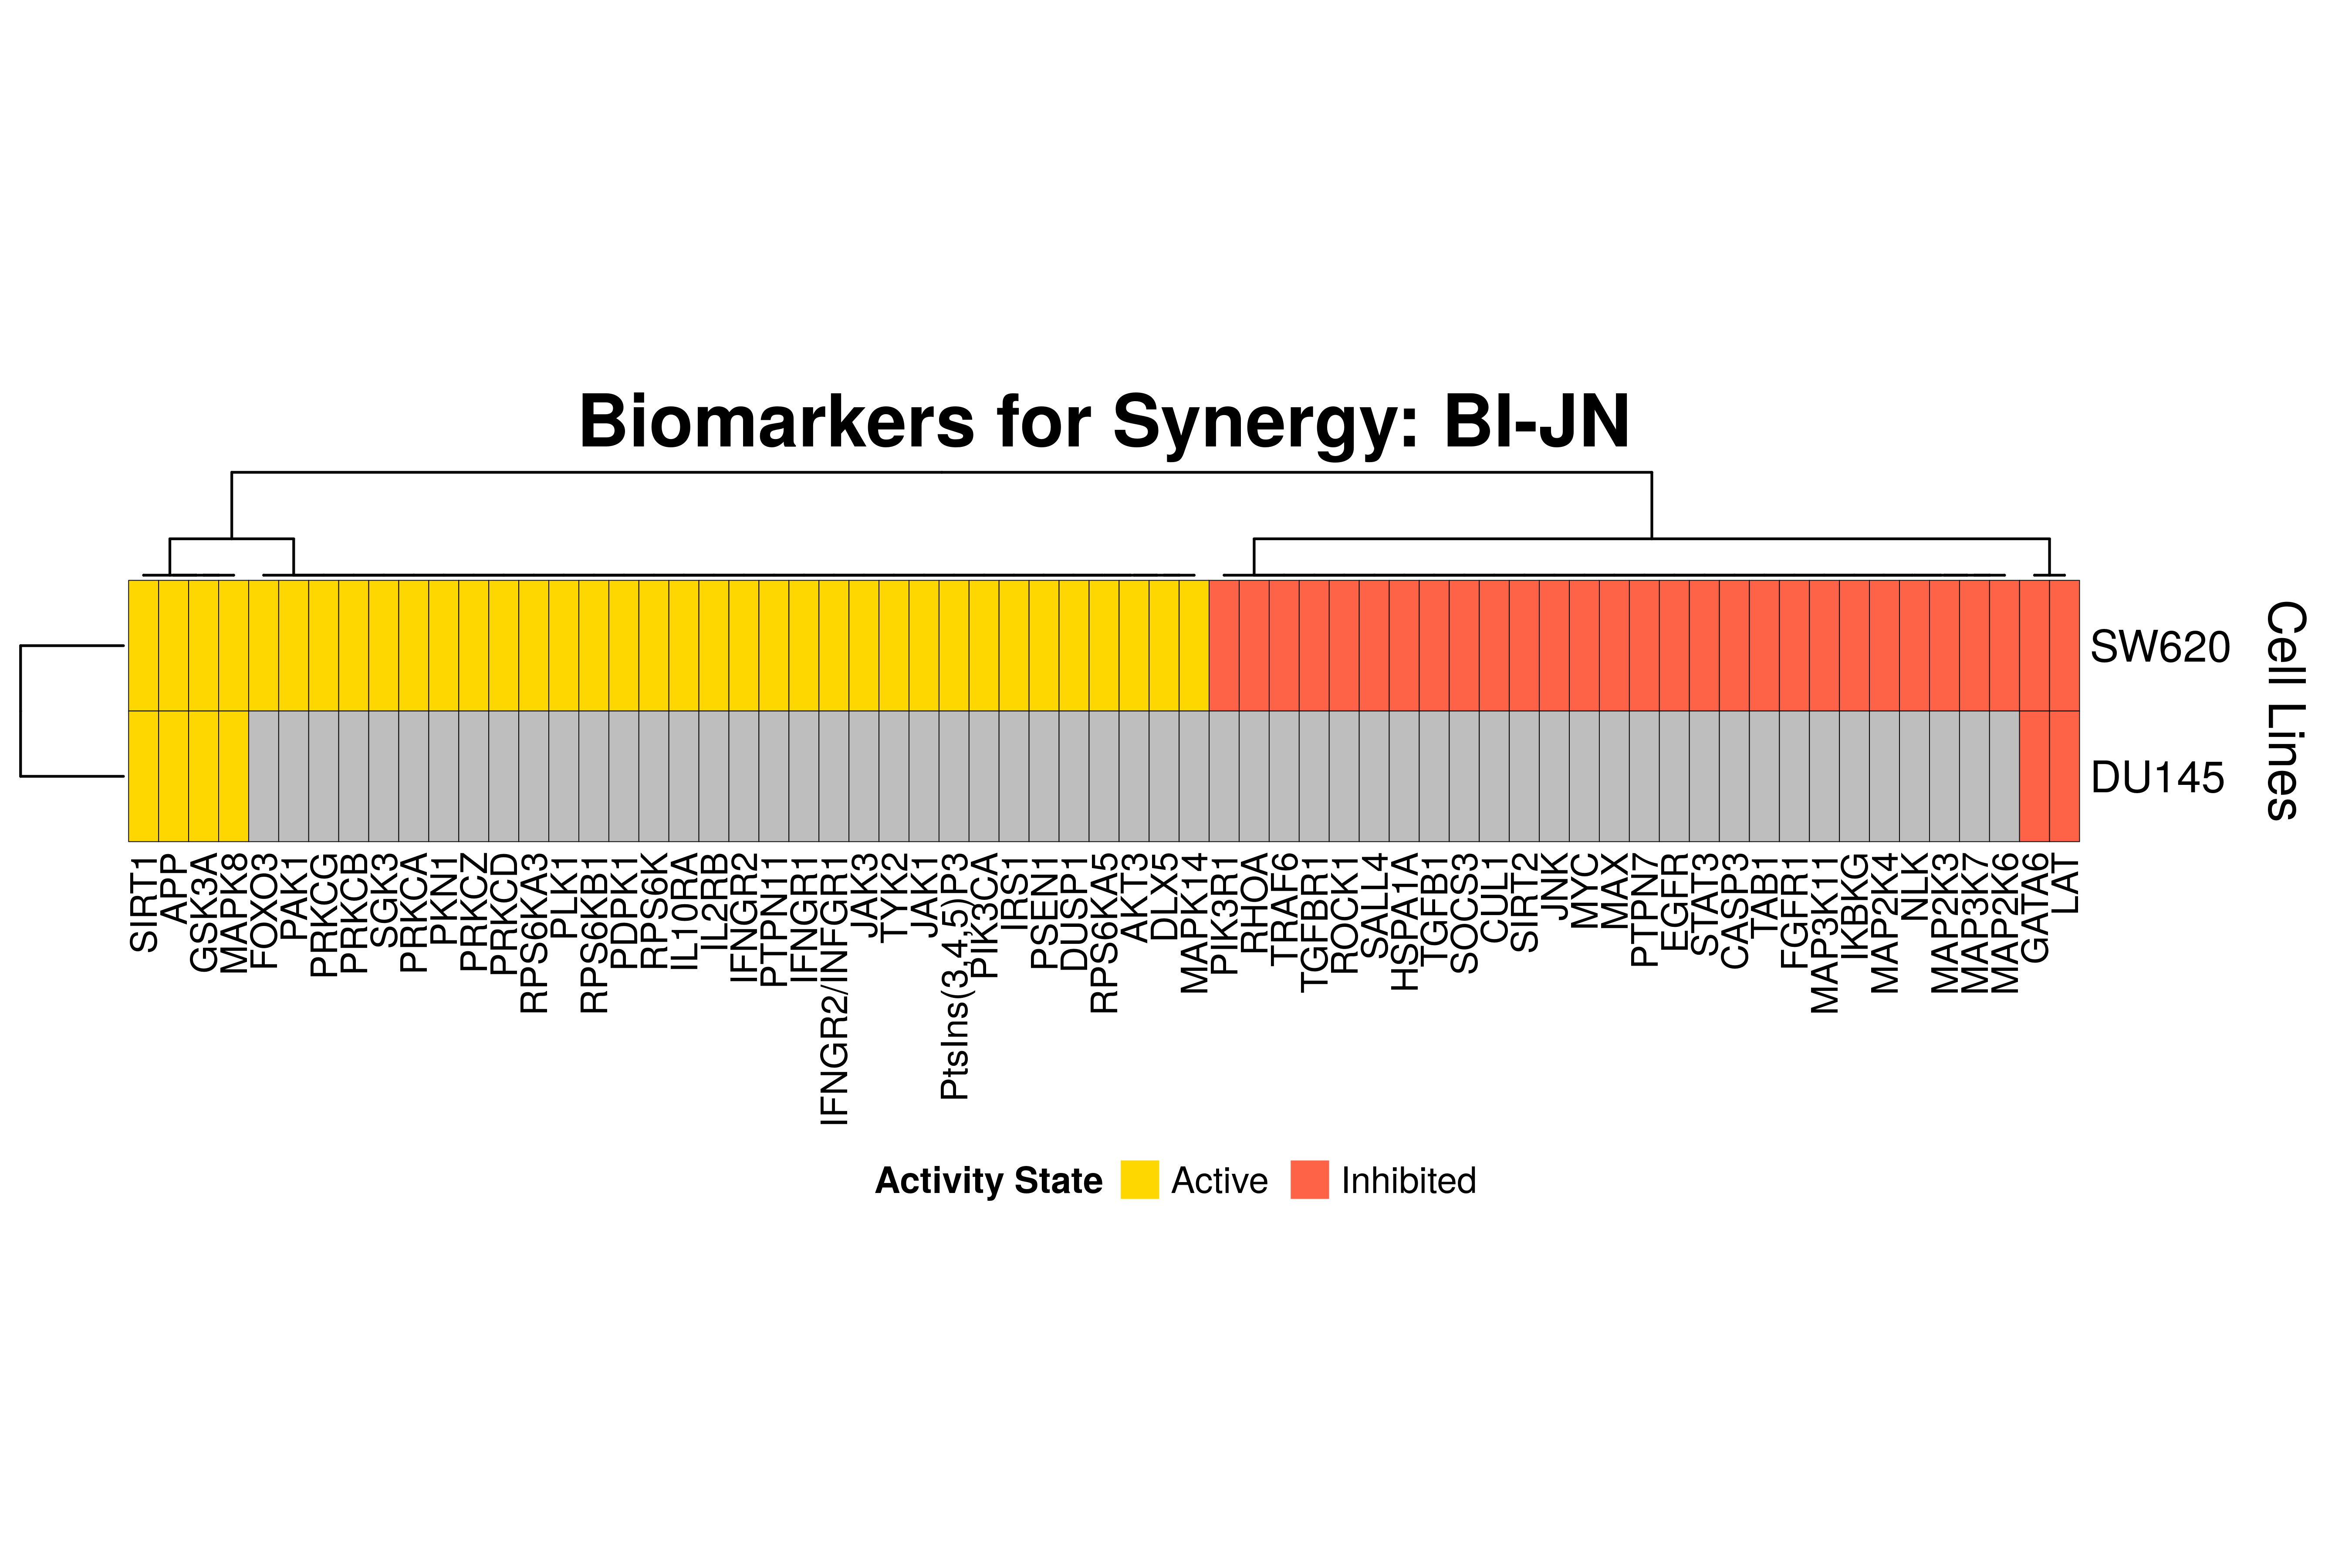
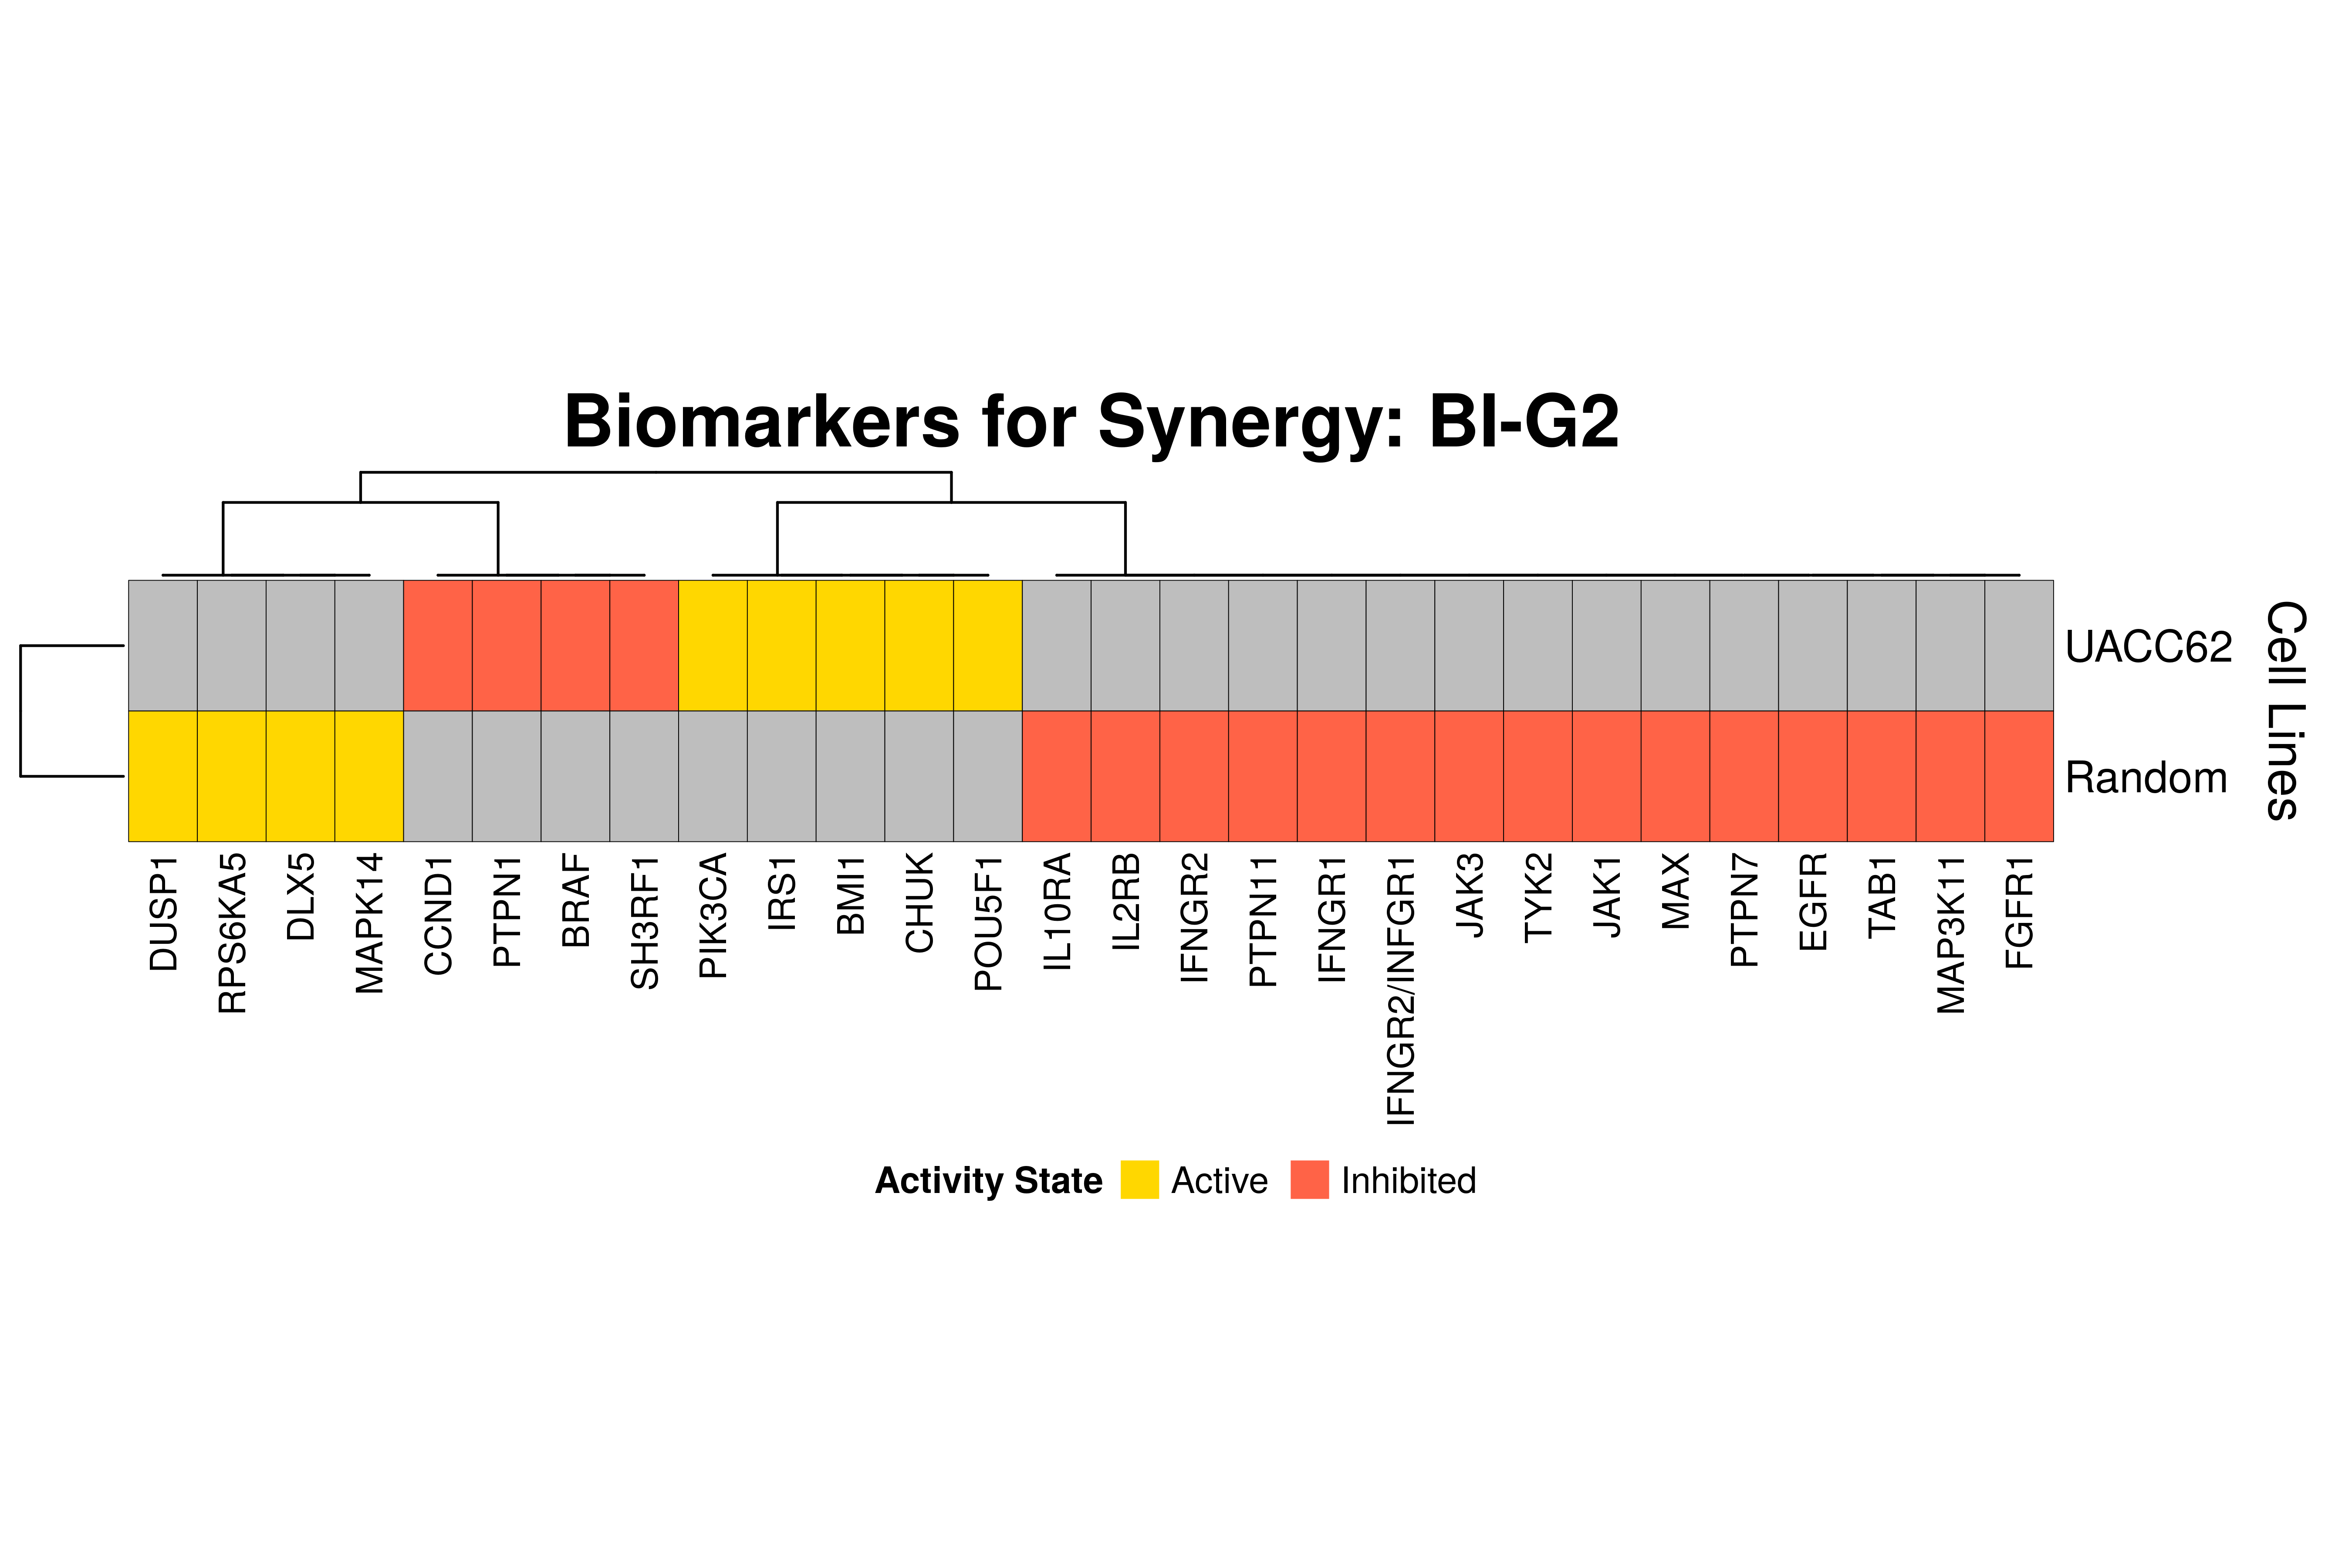
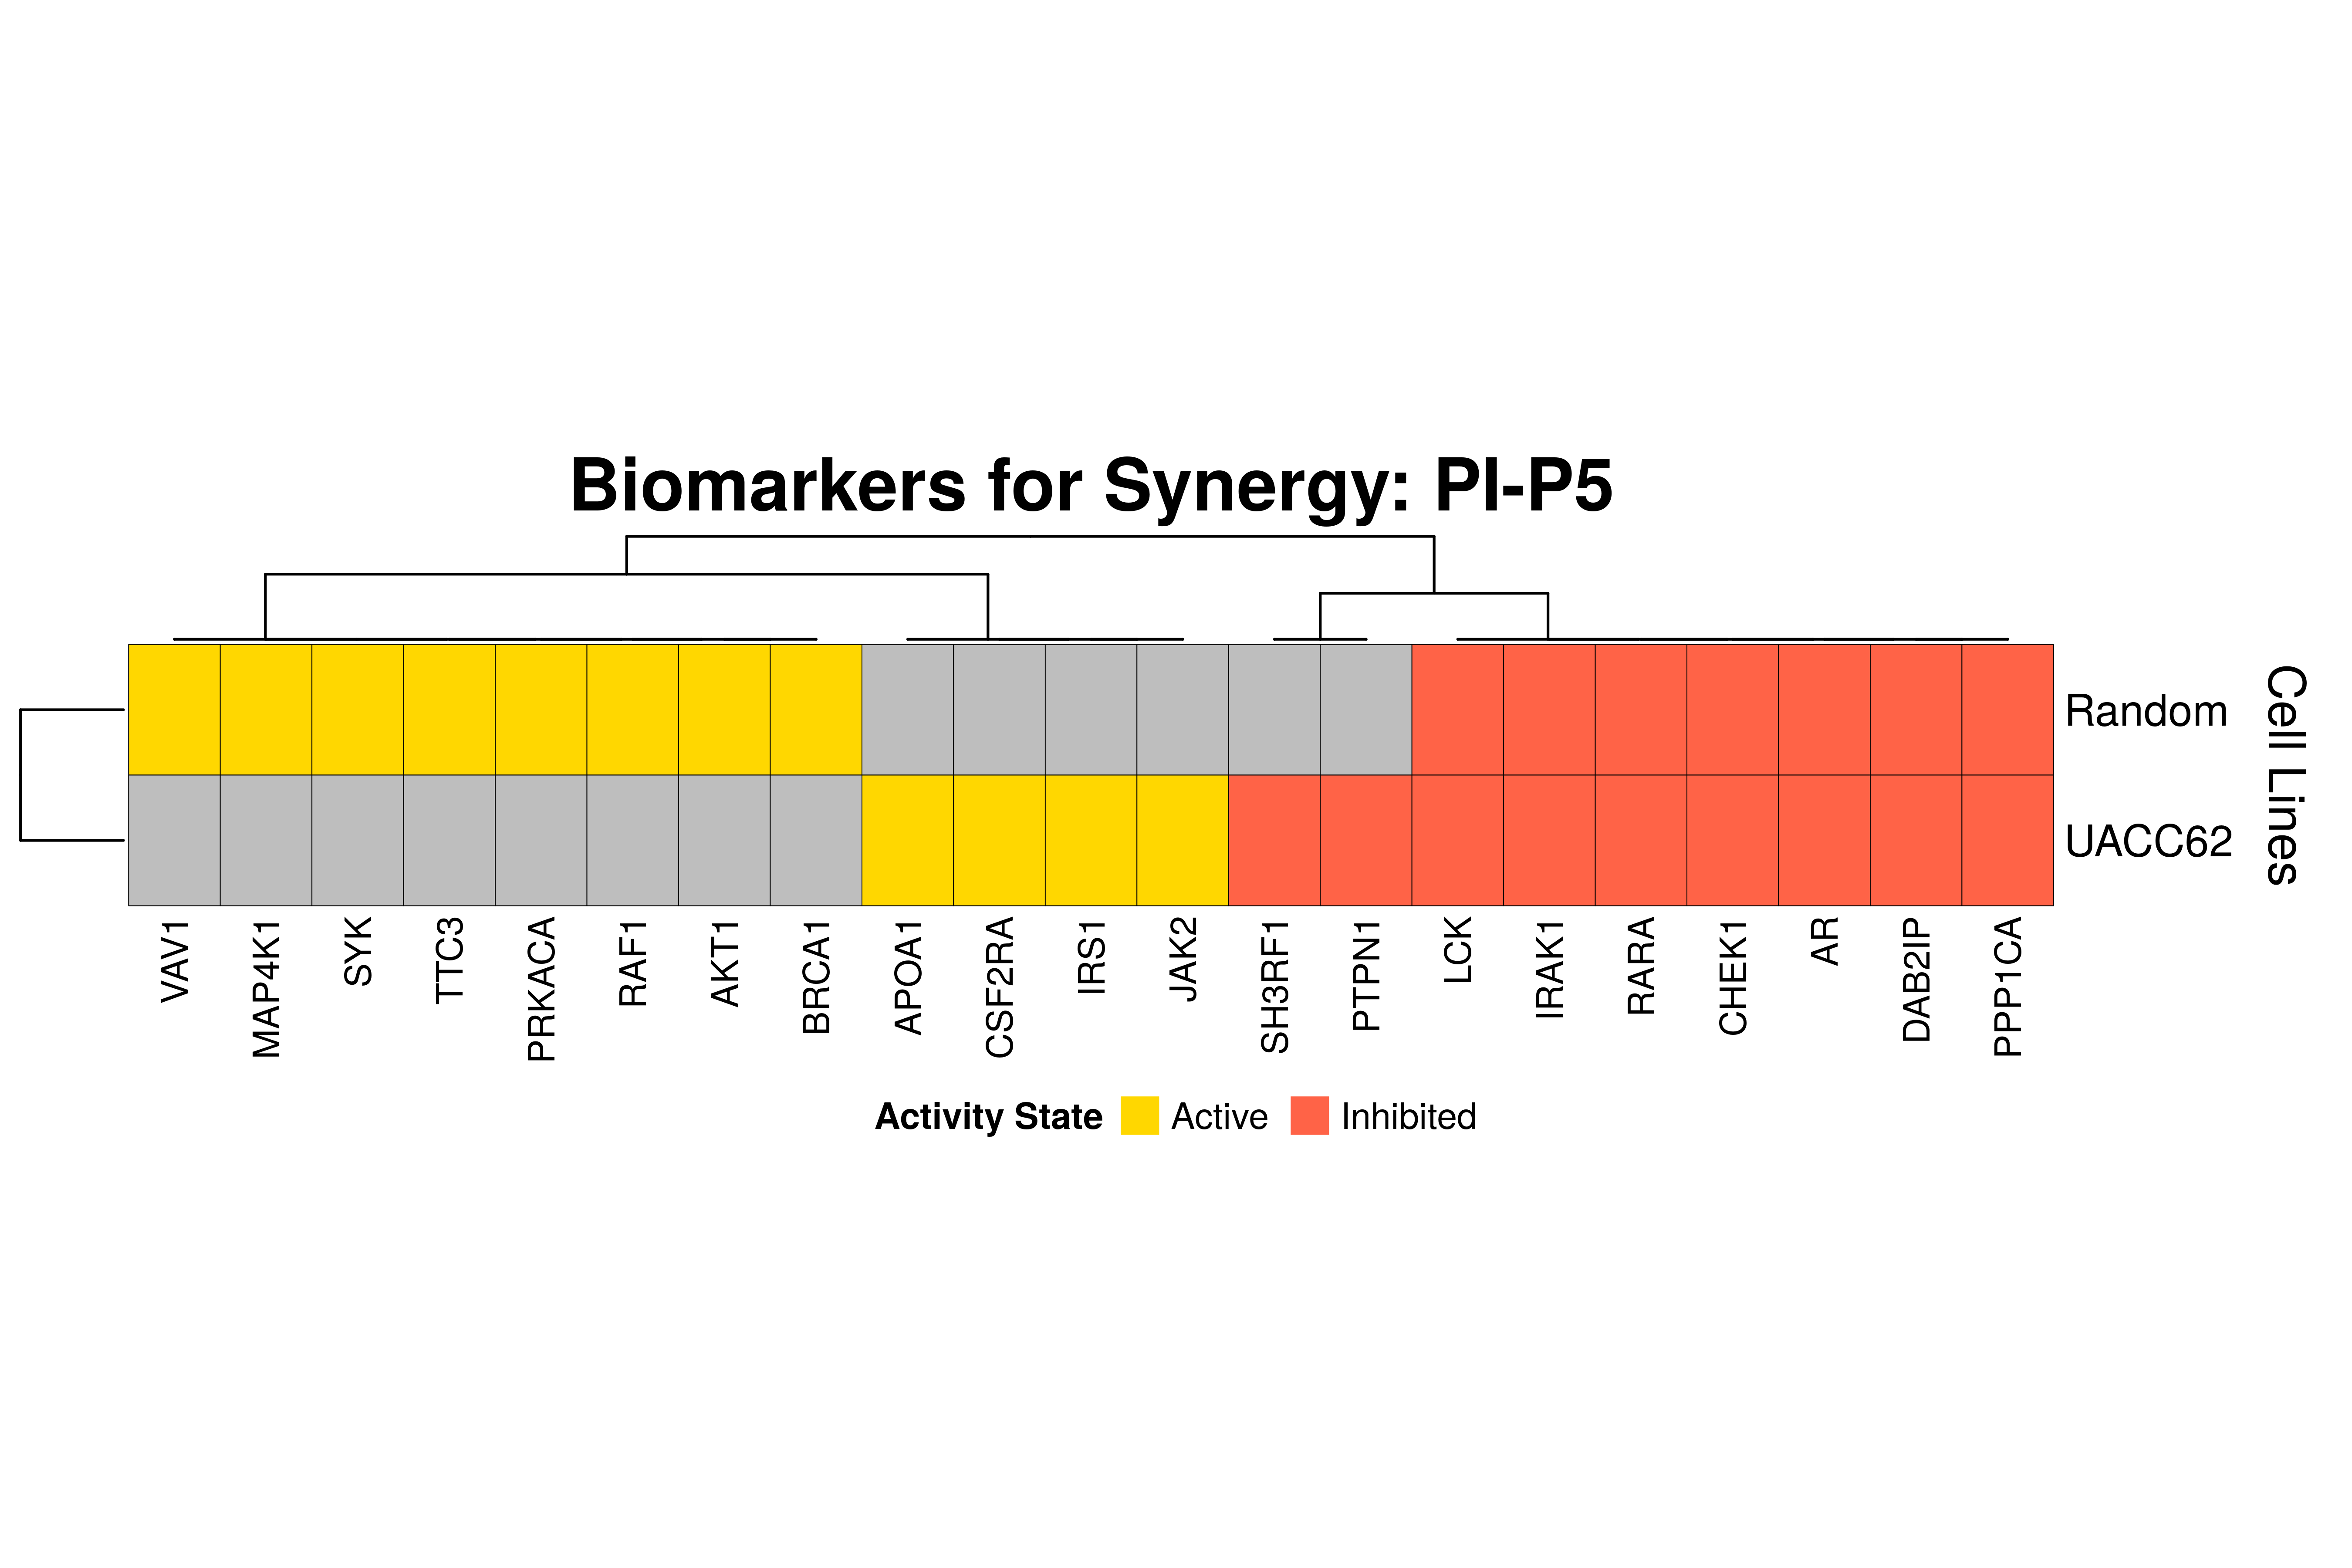
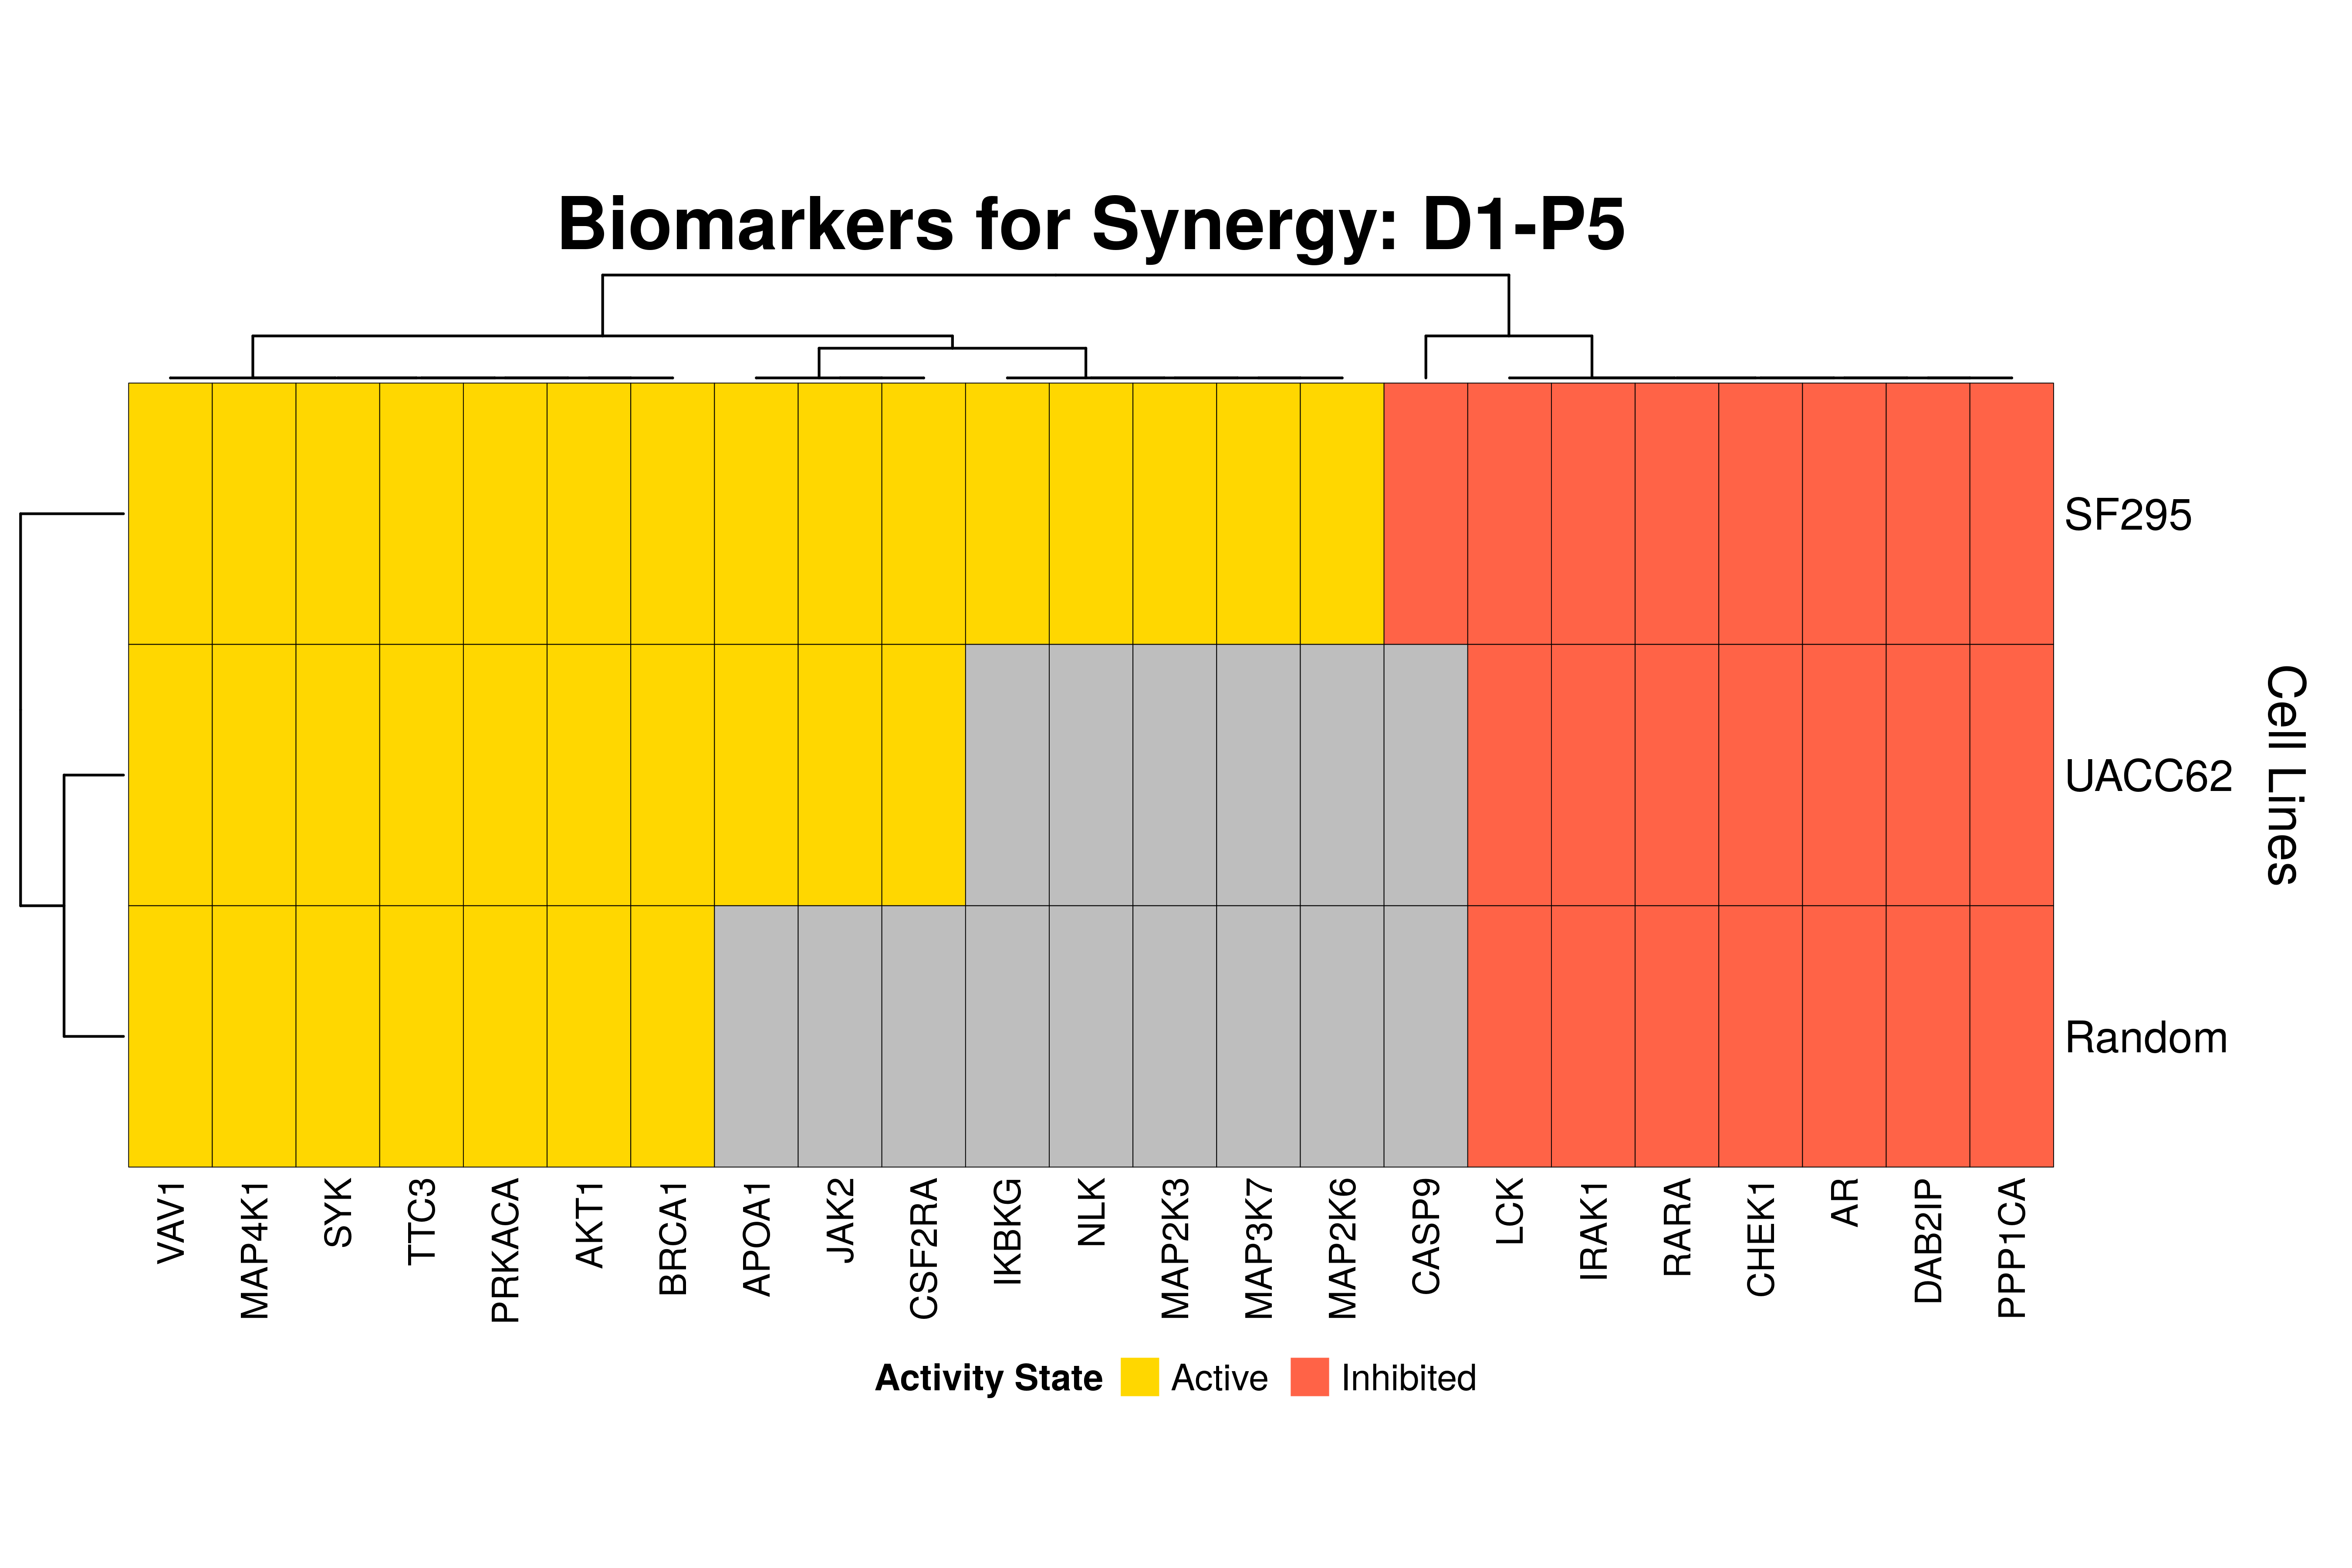
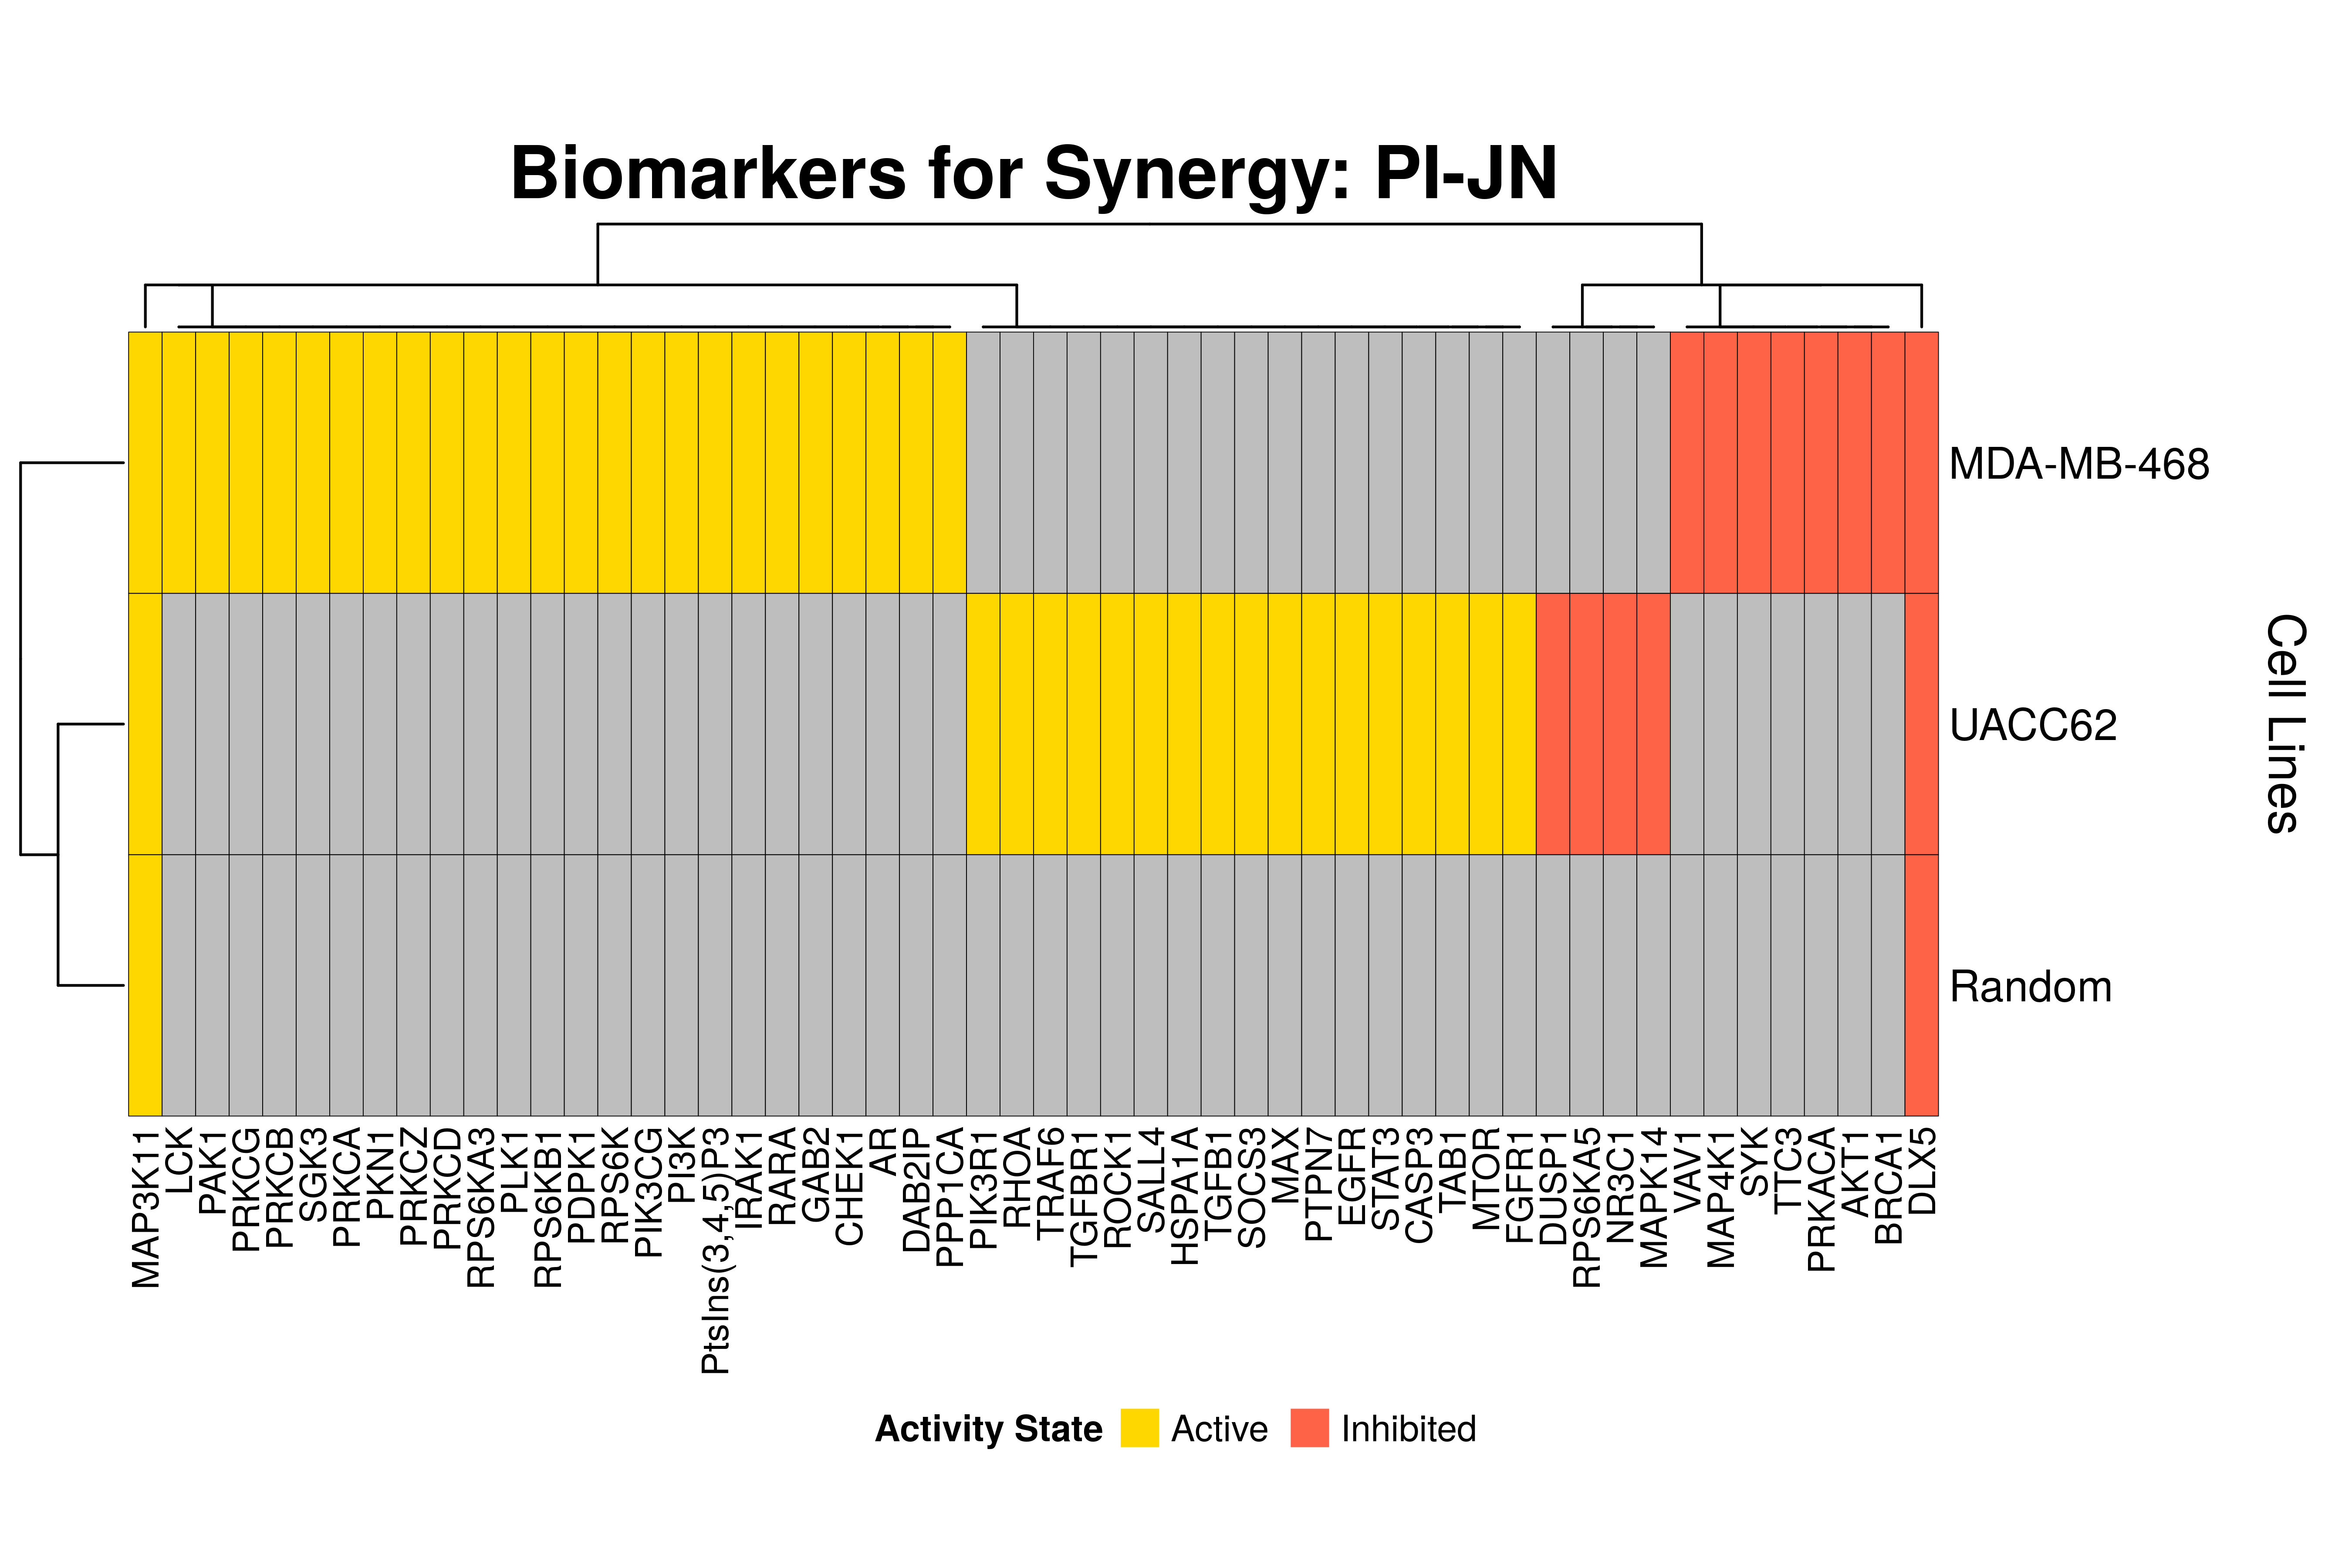
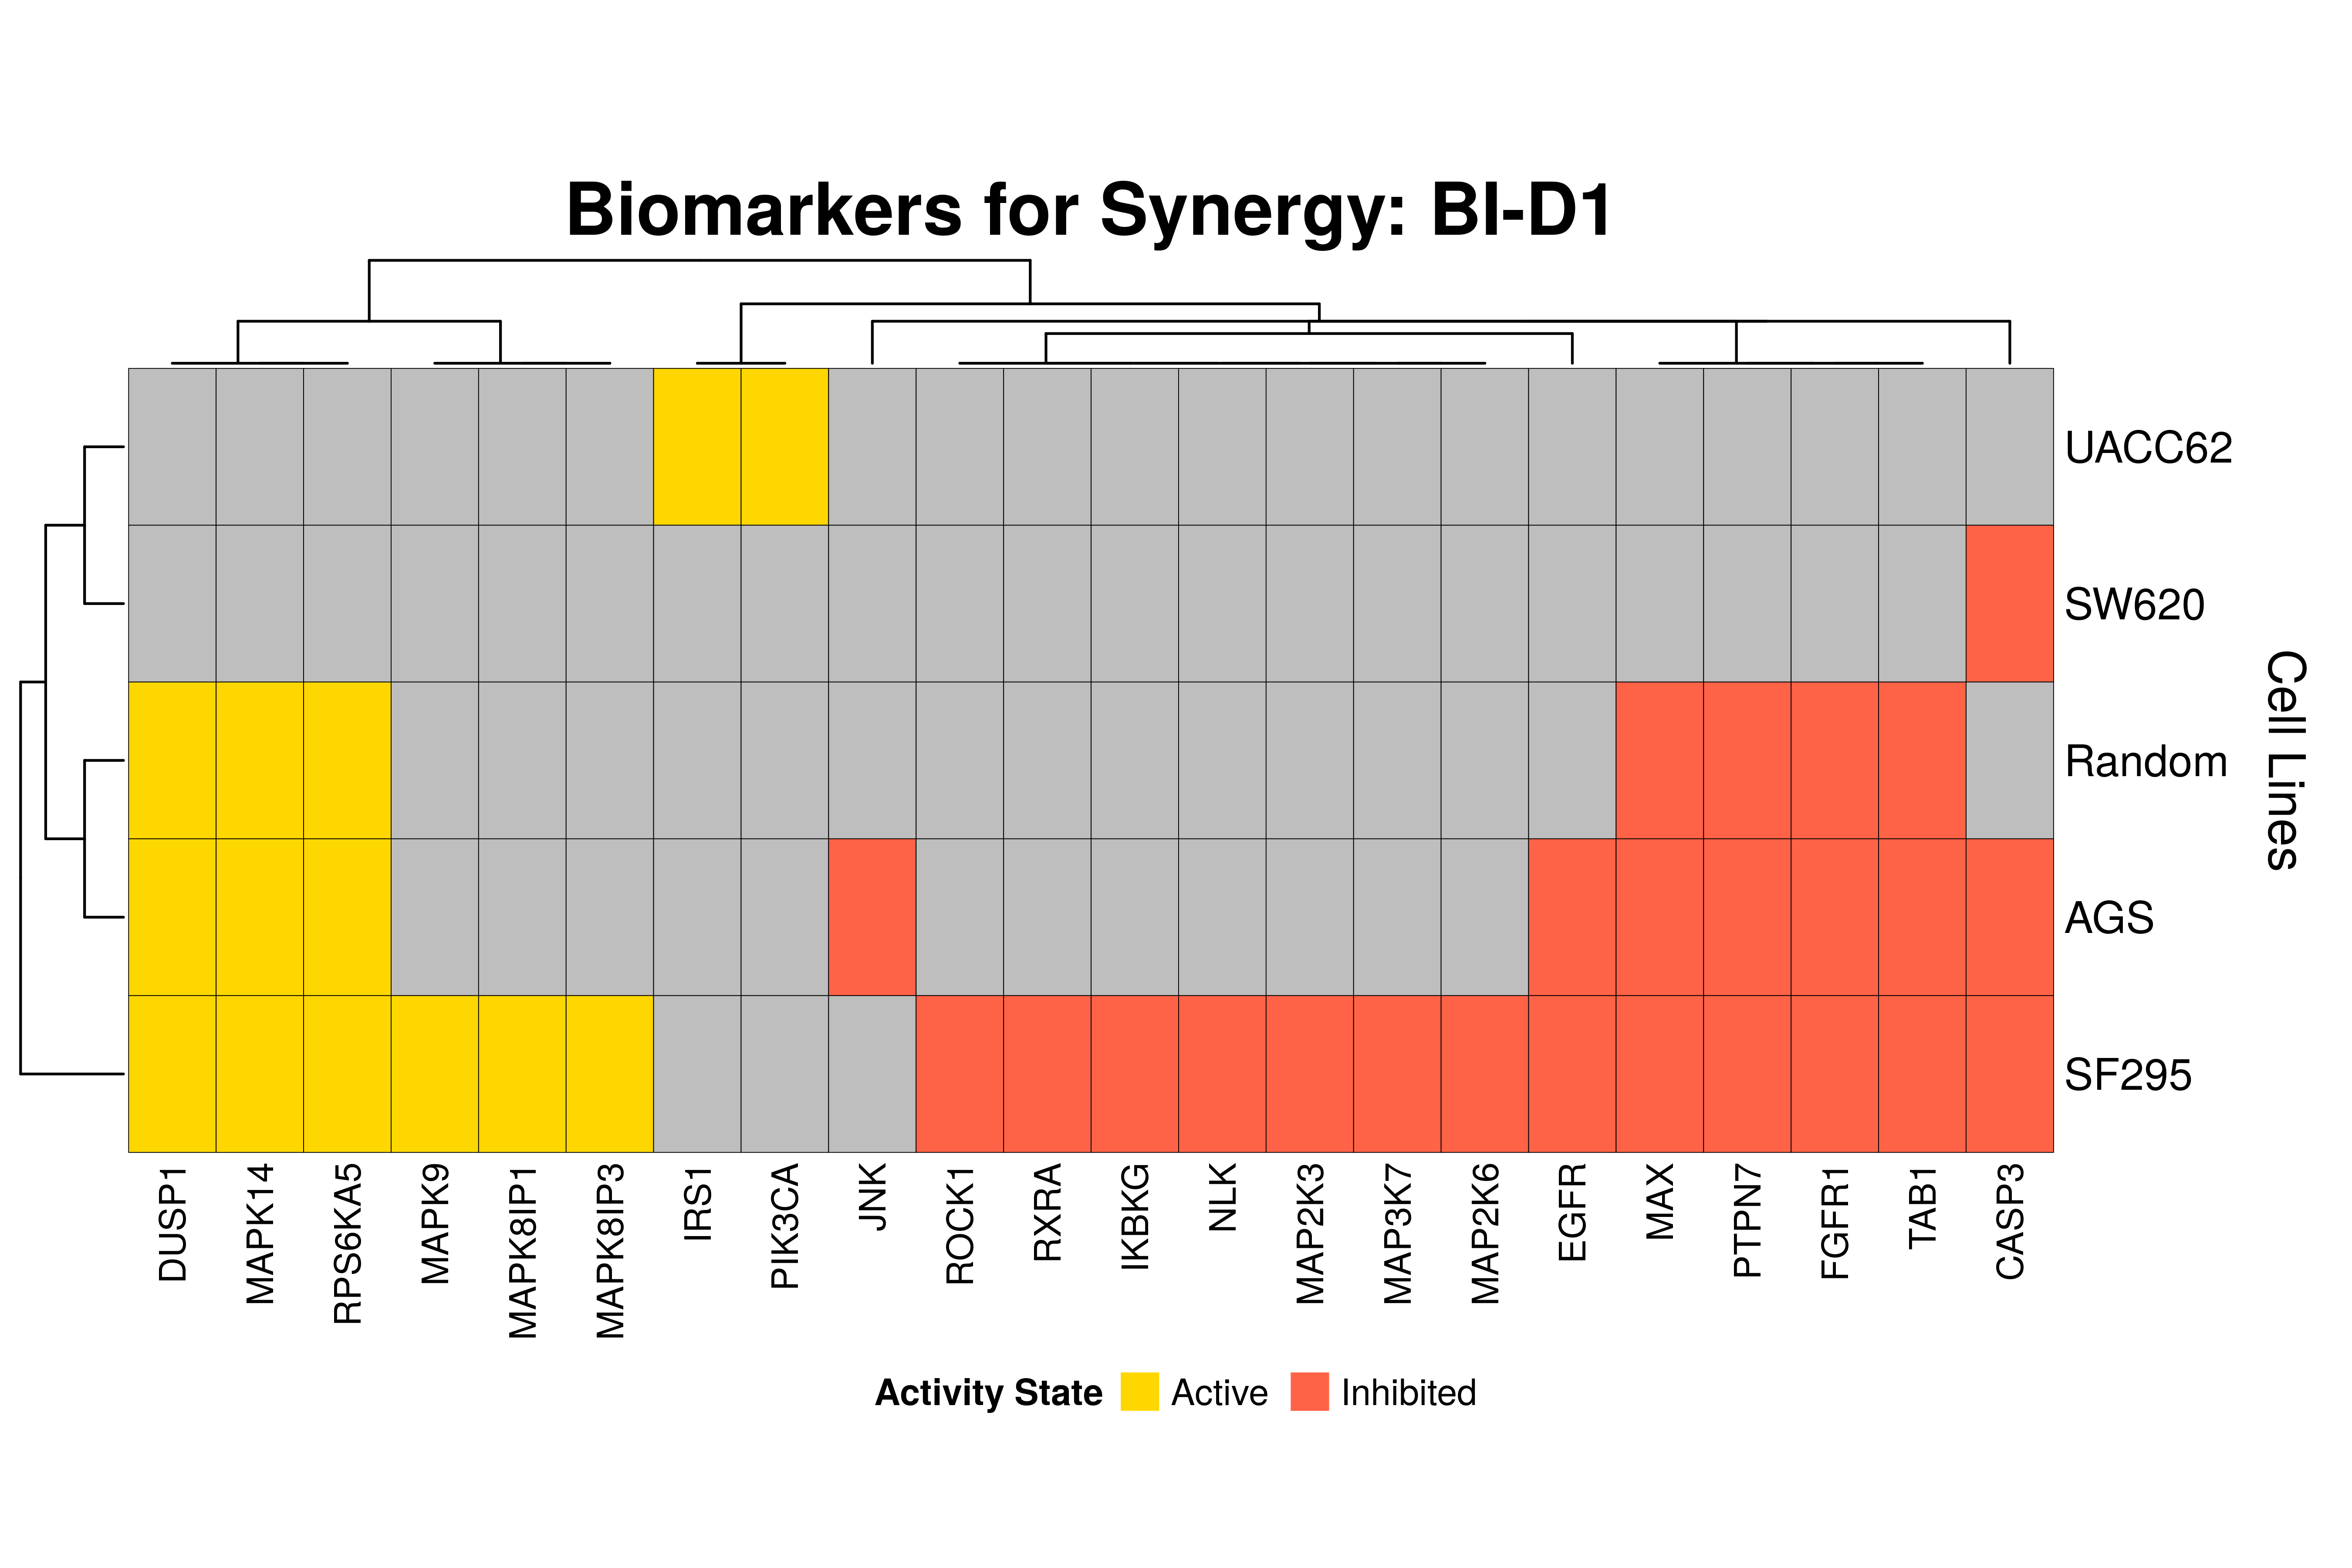
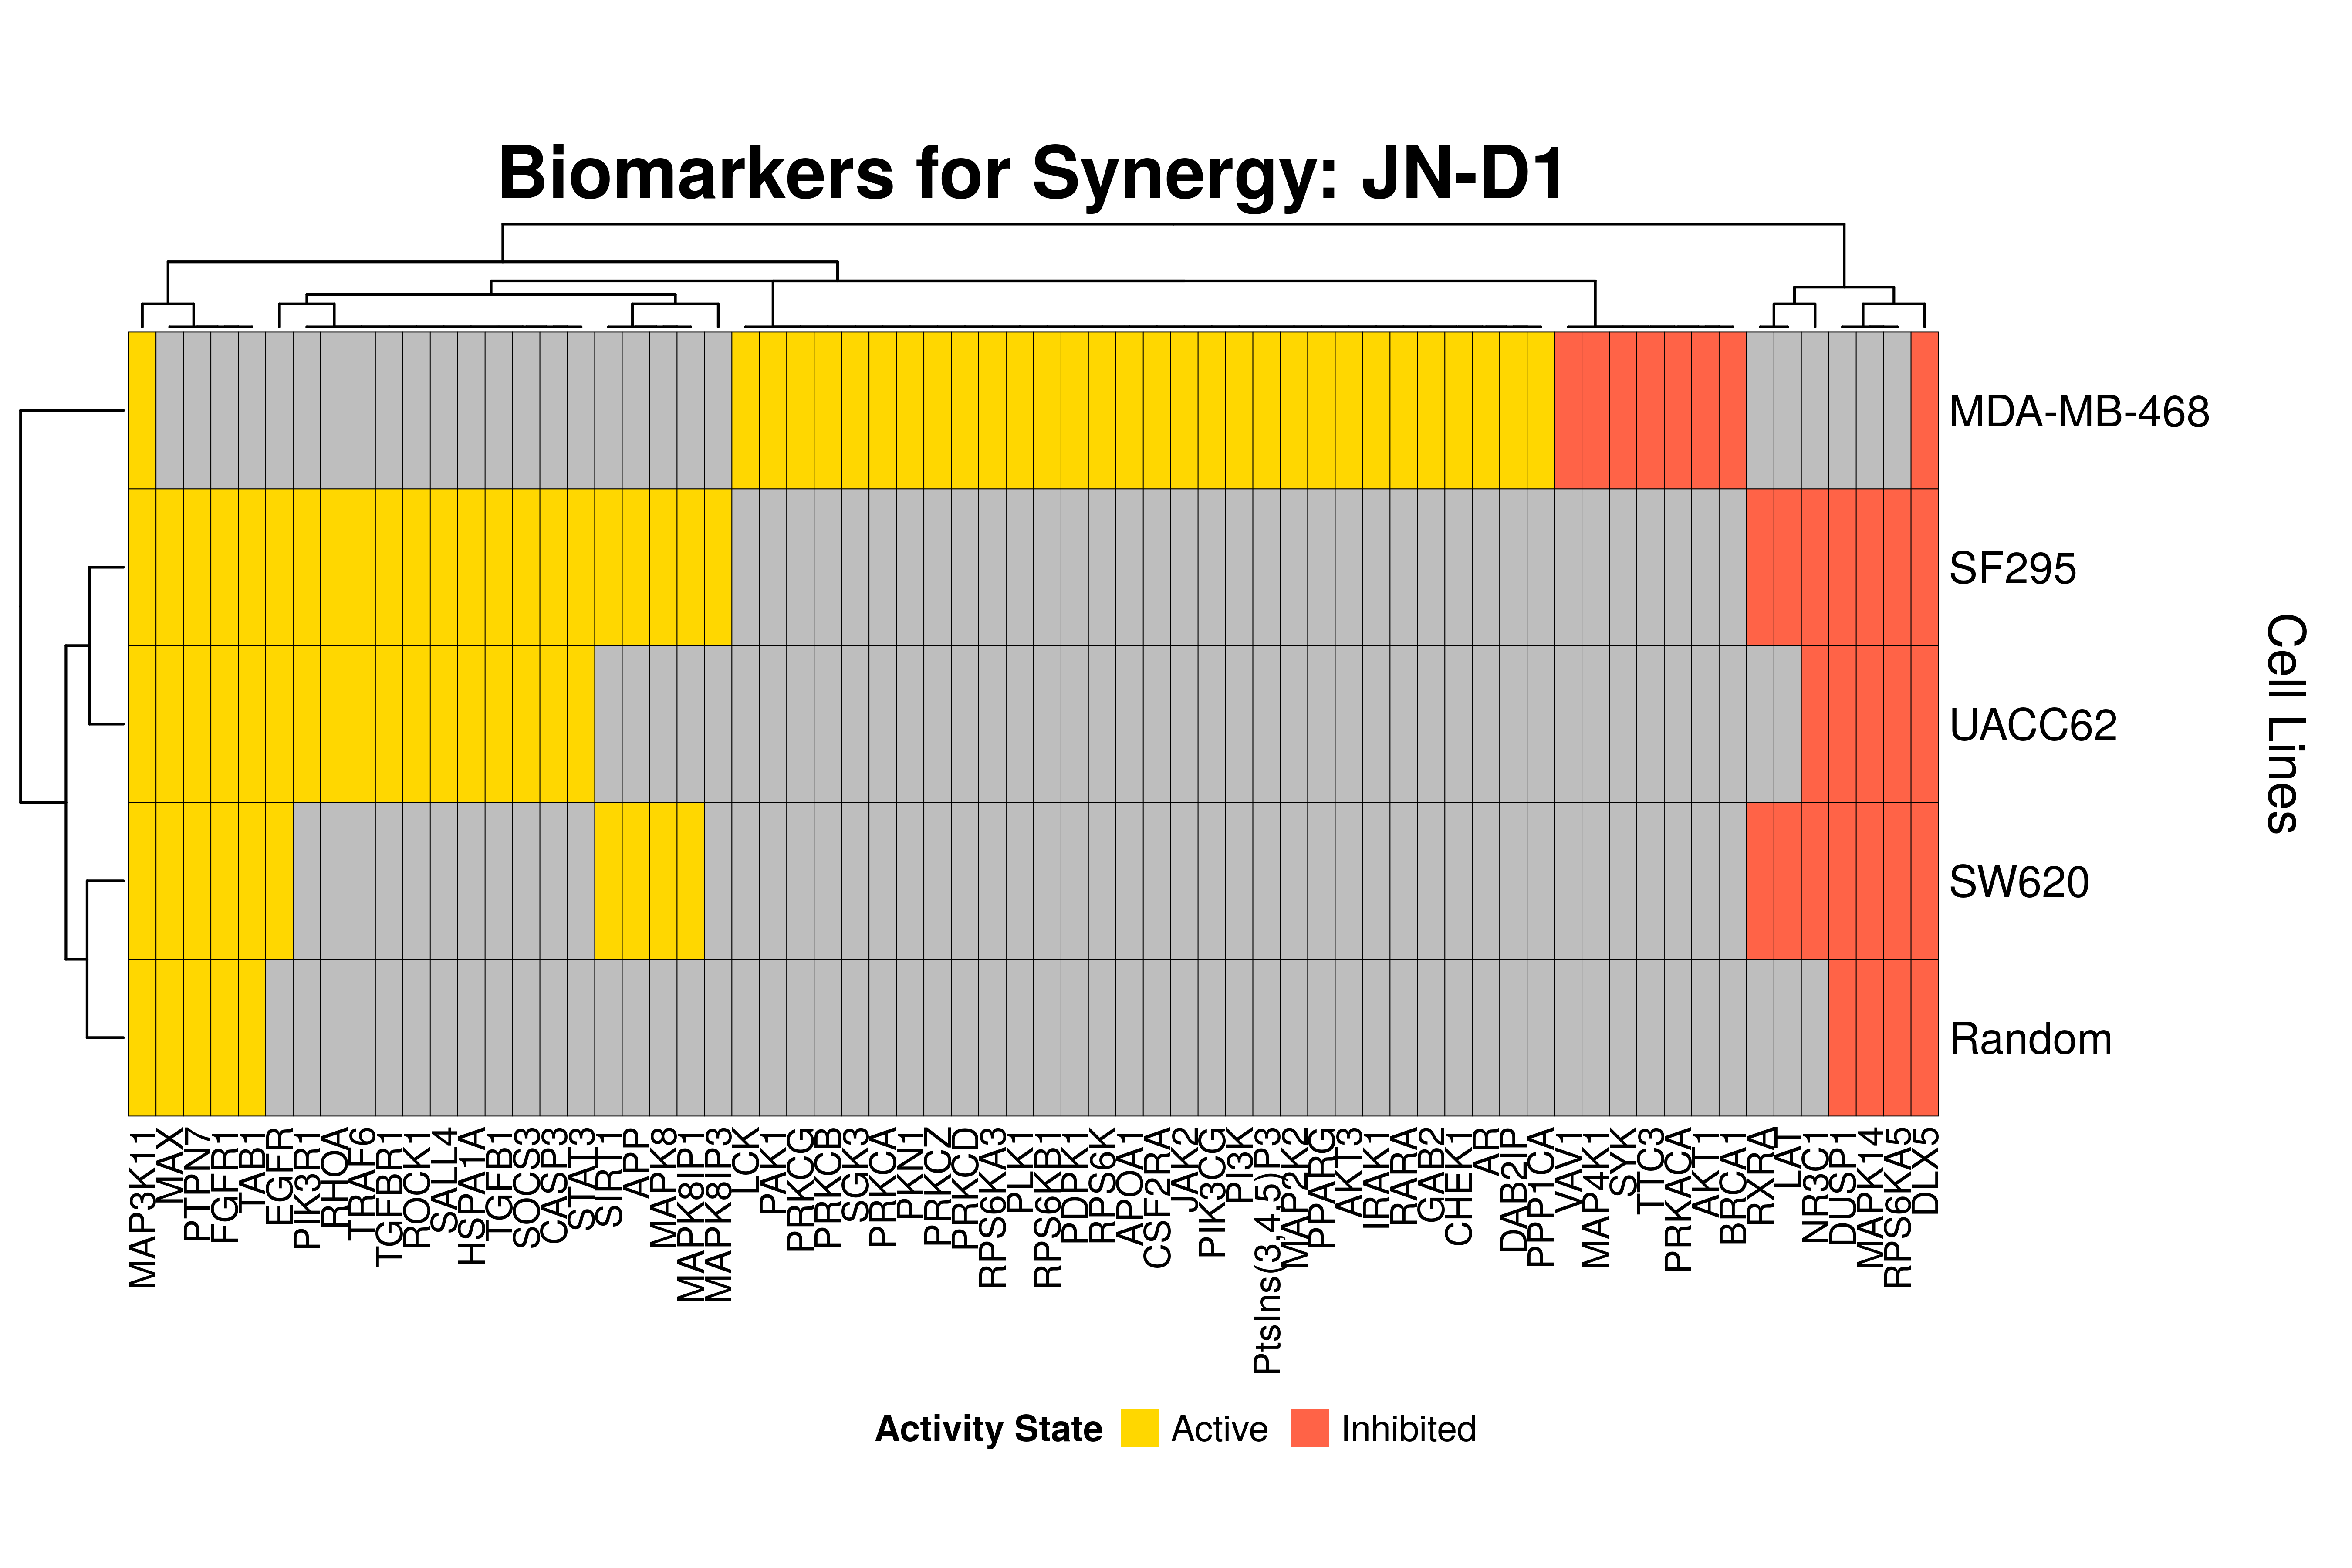
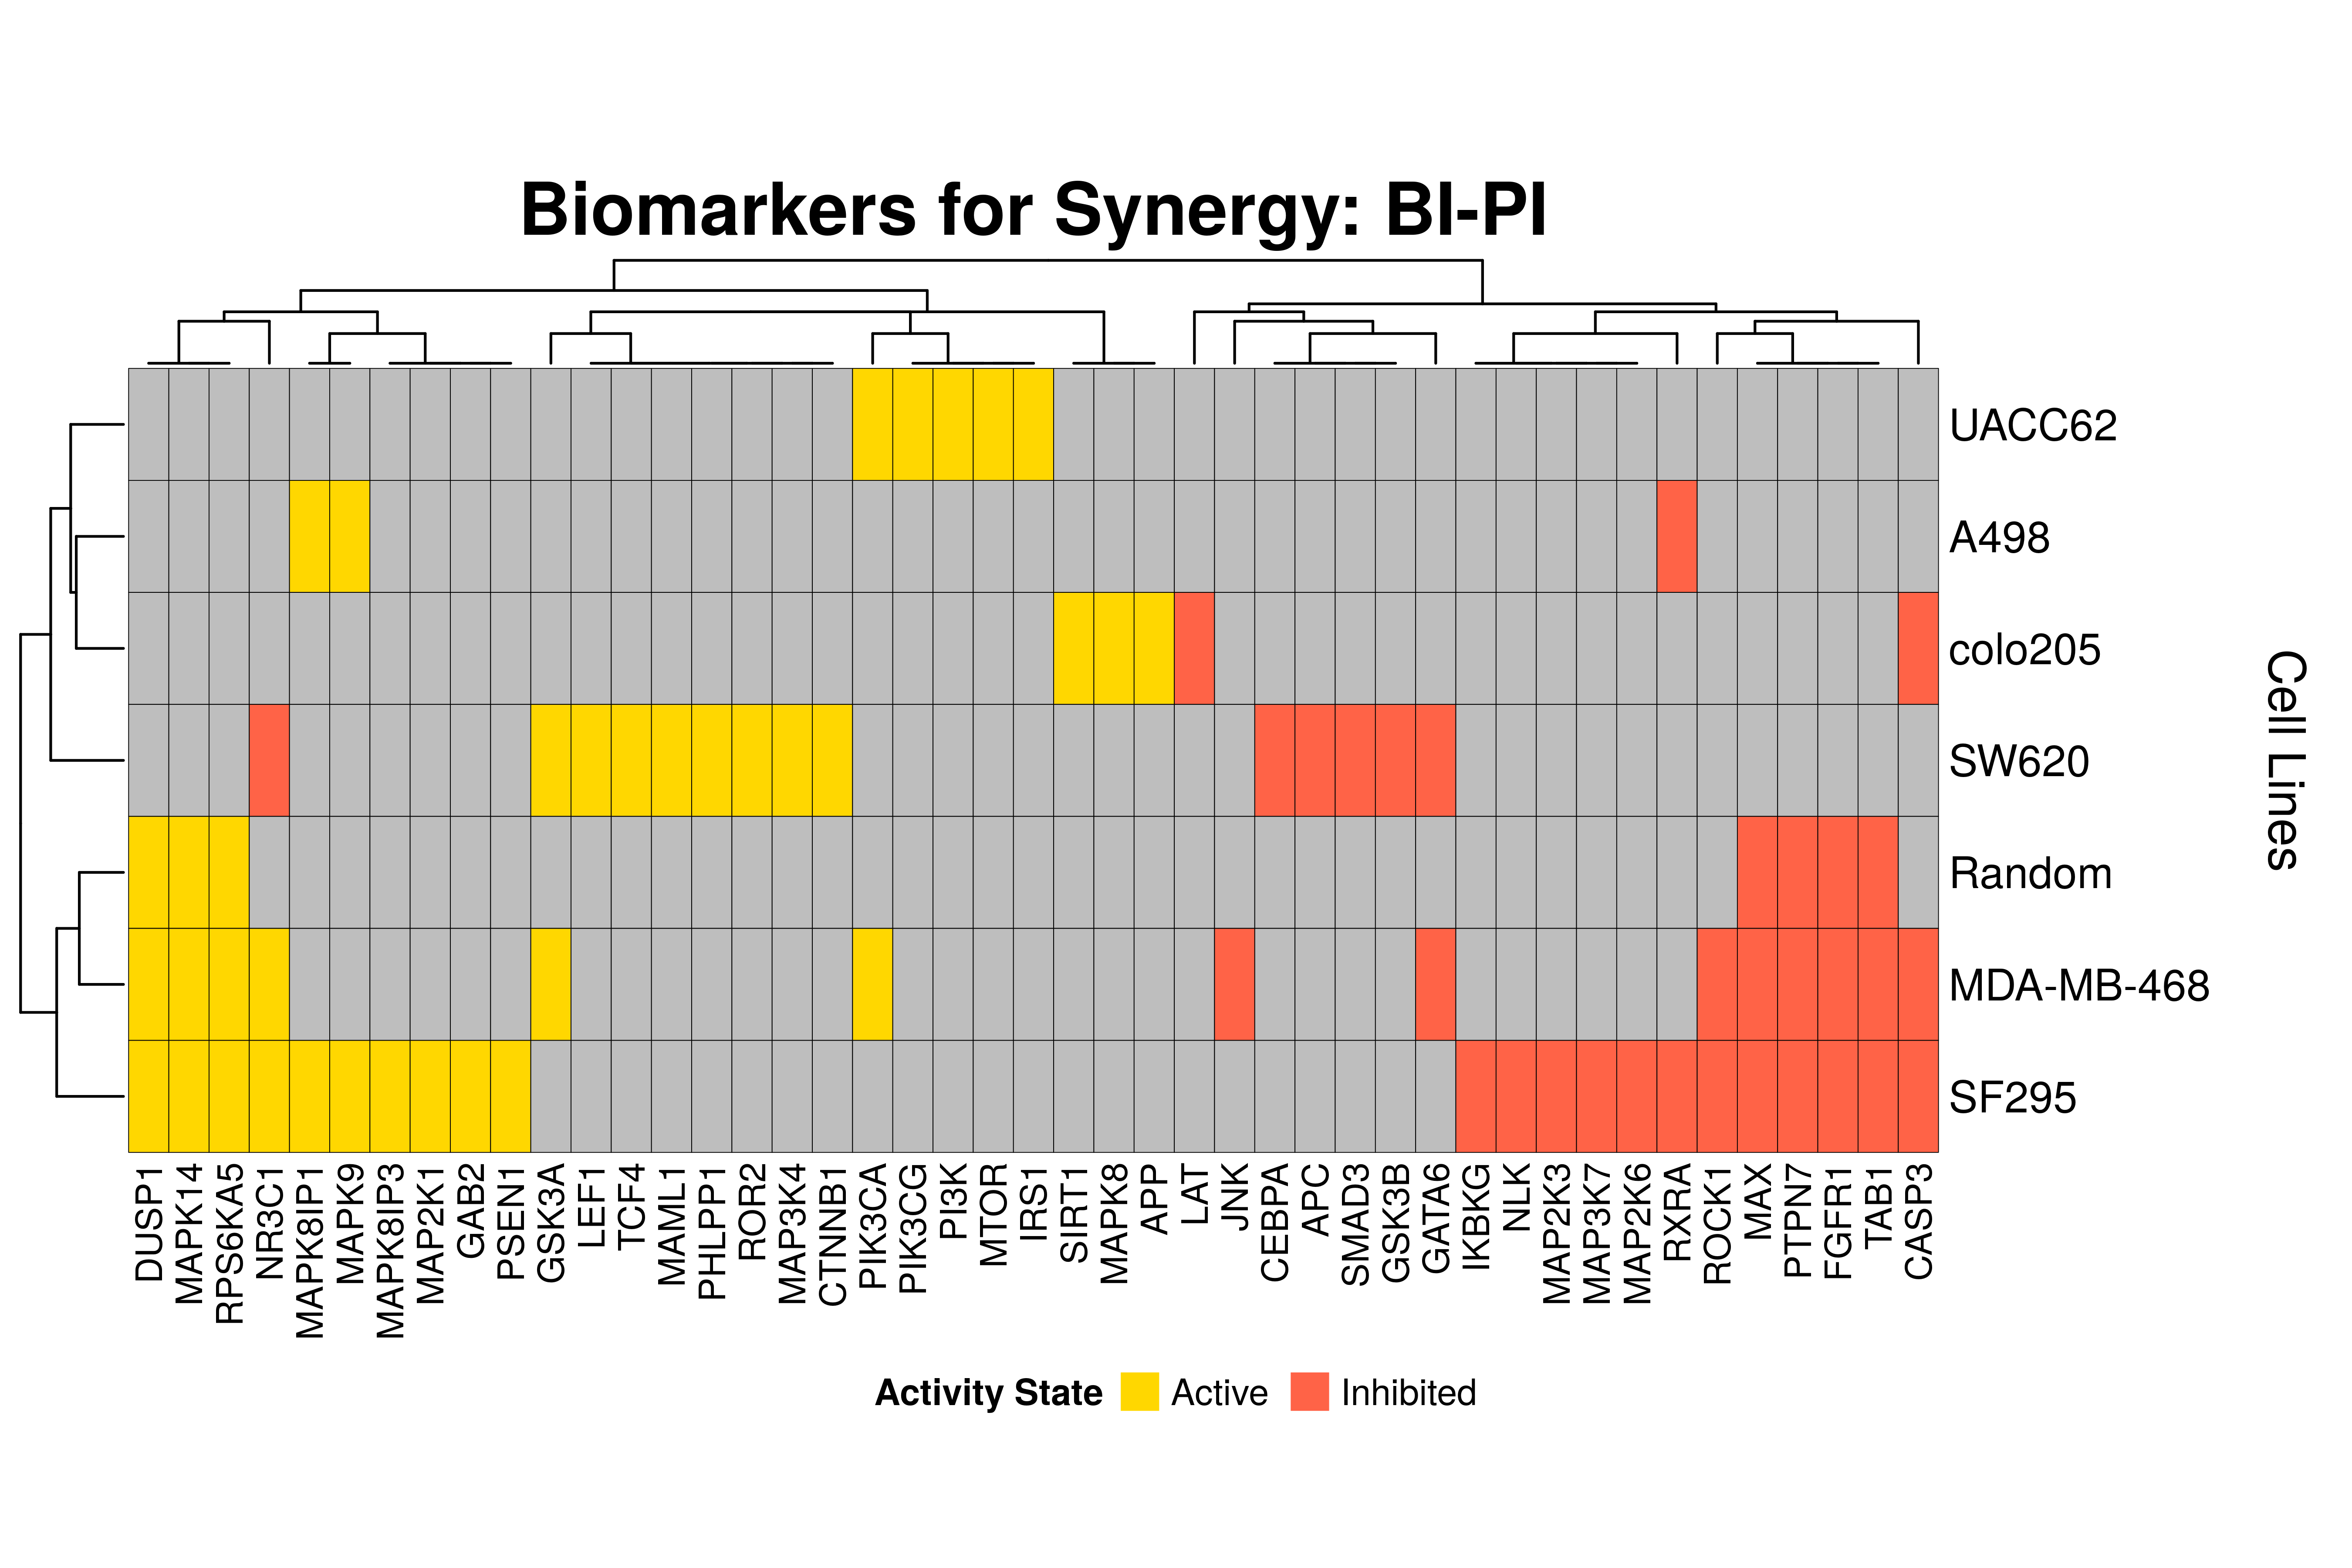
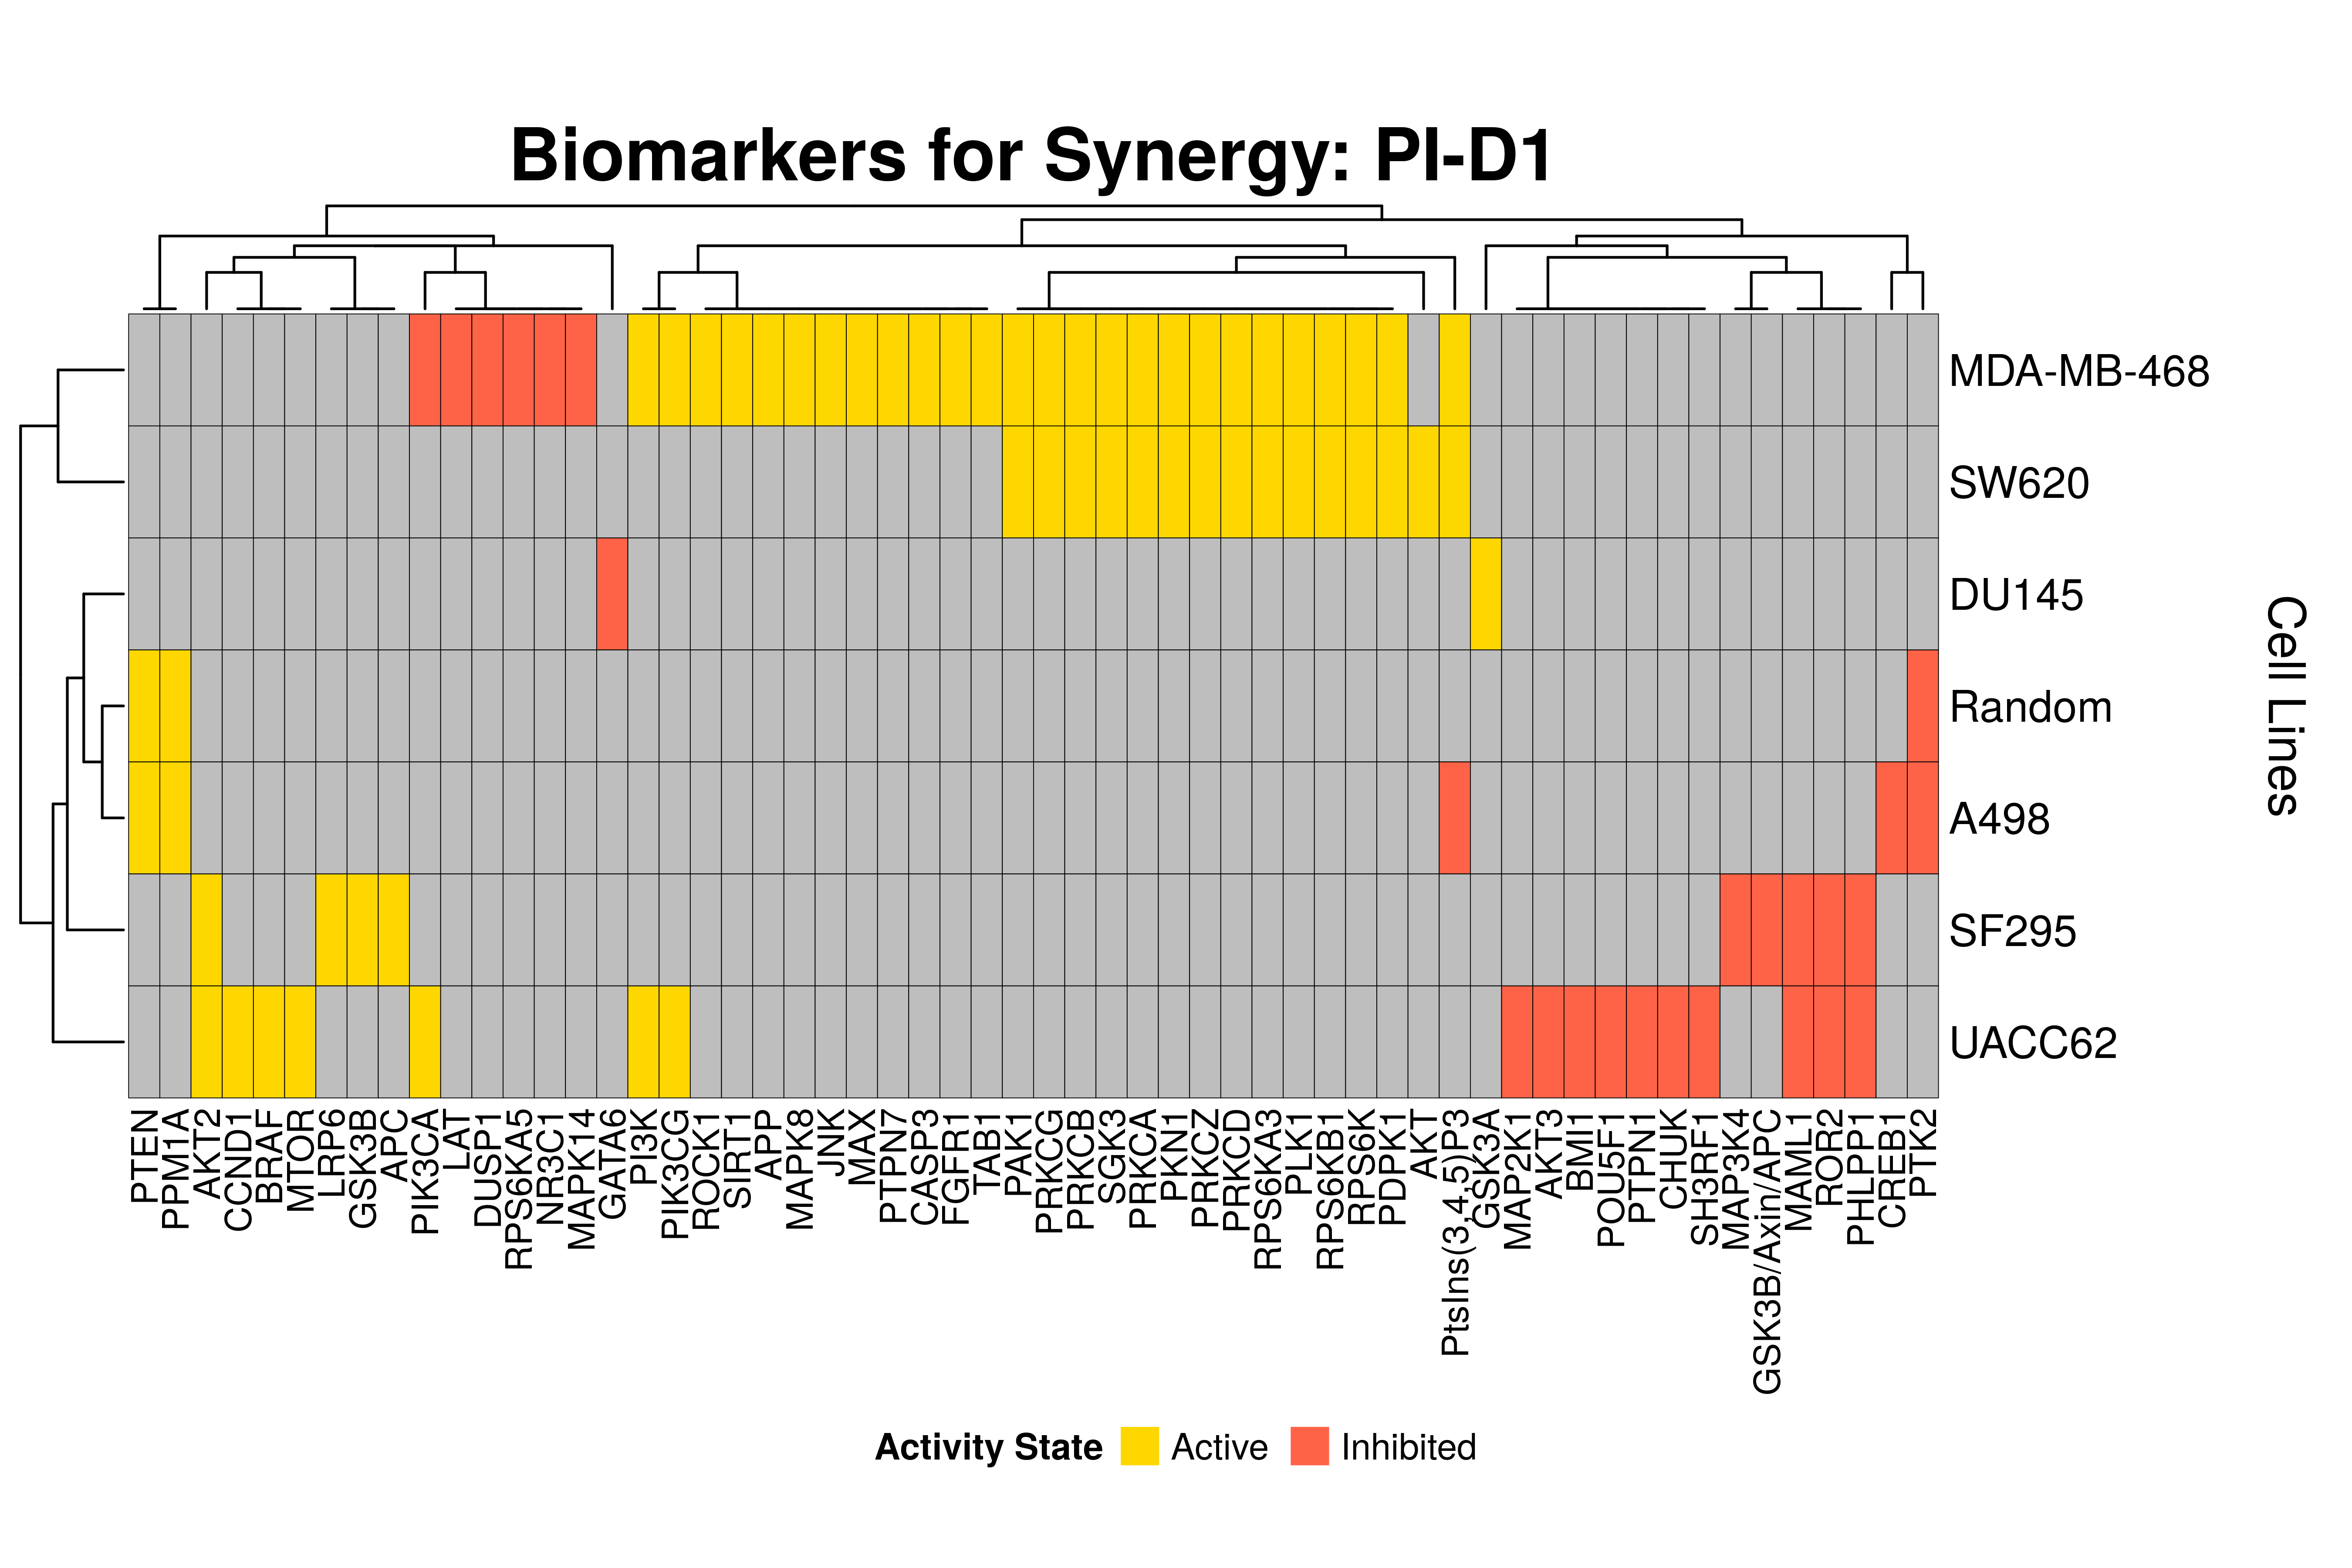
Last remarks:
- The main result here is that we observe common biomarkers across many cell lines and in the same activity state for some synergies, which hints that these biomarkers may have a pan-cancer diagnostic value.
- There are fewer biomarkers in general found for the random model analysis comparing to the
cell-specific models. The
biomarker_synergy_analysisgeneral function that was used to find these biomarkers from the random models does not incorporate the synergy-set prediction based analysis that was done for each cell line model analysis (and which was used to better identify and/or refine the biomarkers responsible for allowing the models to predict one extra synergy from a specific (observed) synergy set). - The random models biomarkers are in most cases found also by the cell-specific models in one or more cell-lines.