CASCADE 1.0 - General
Network Properties
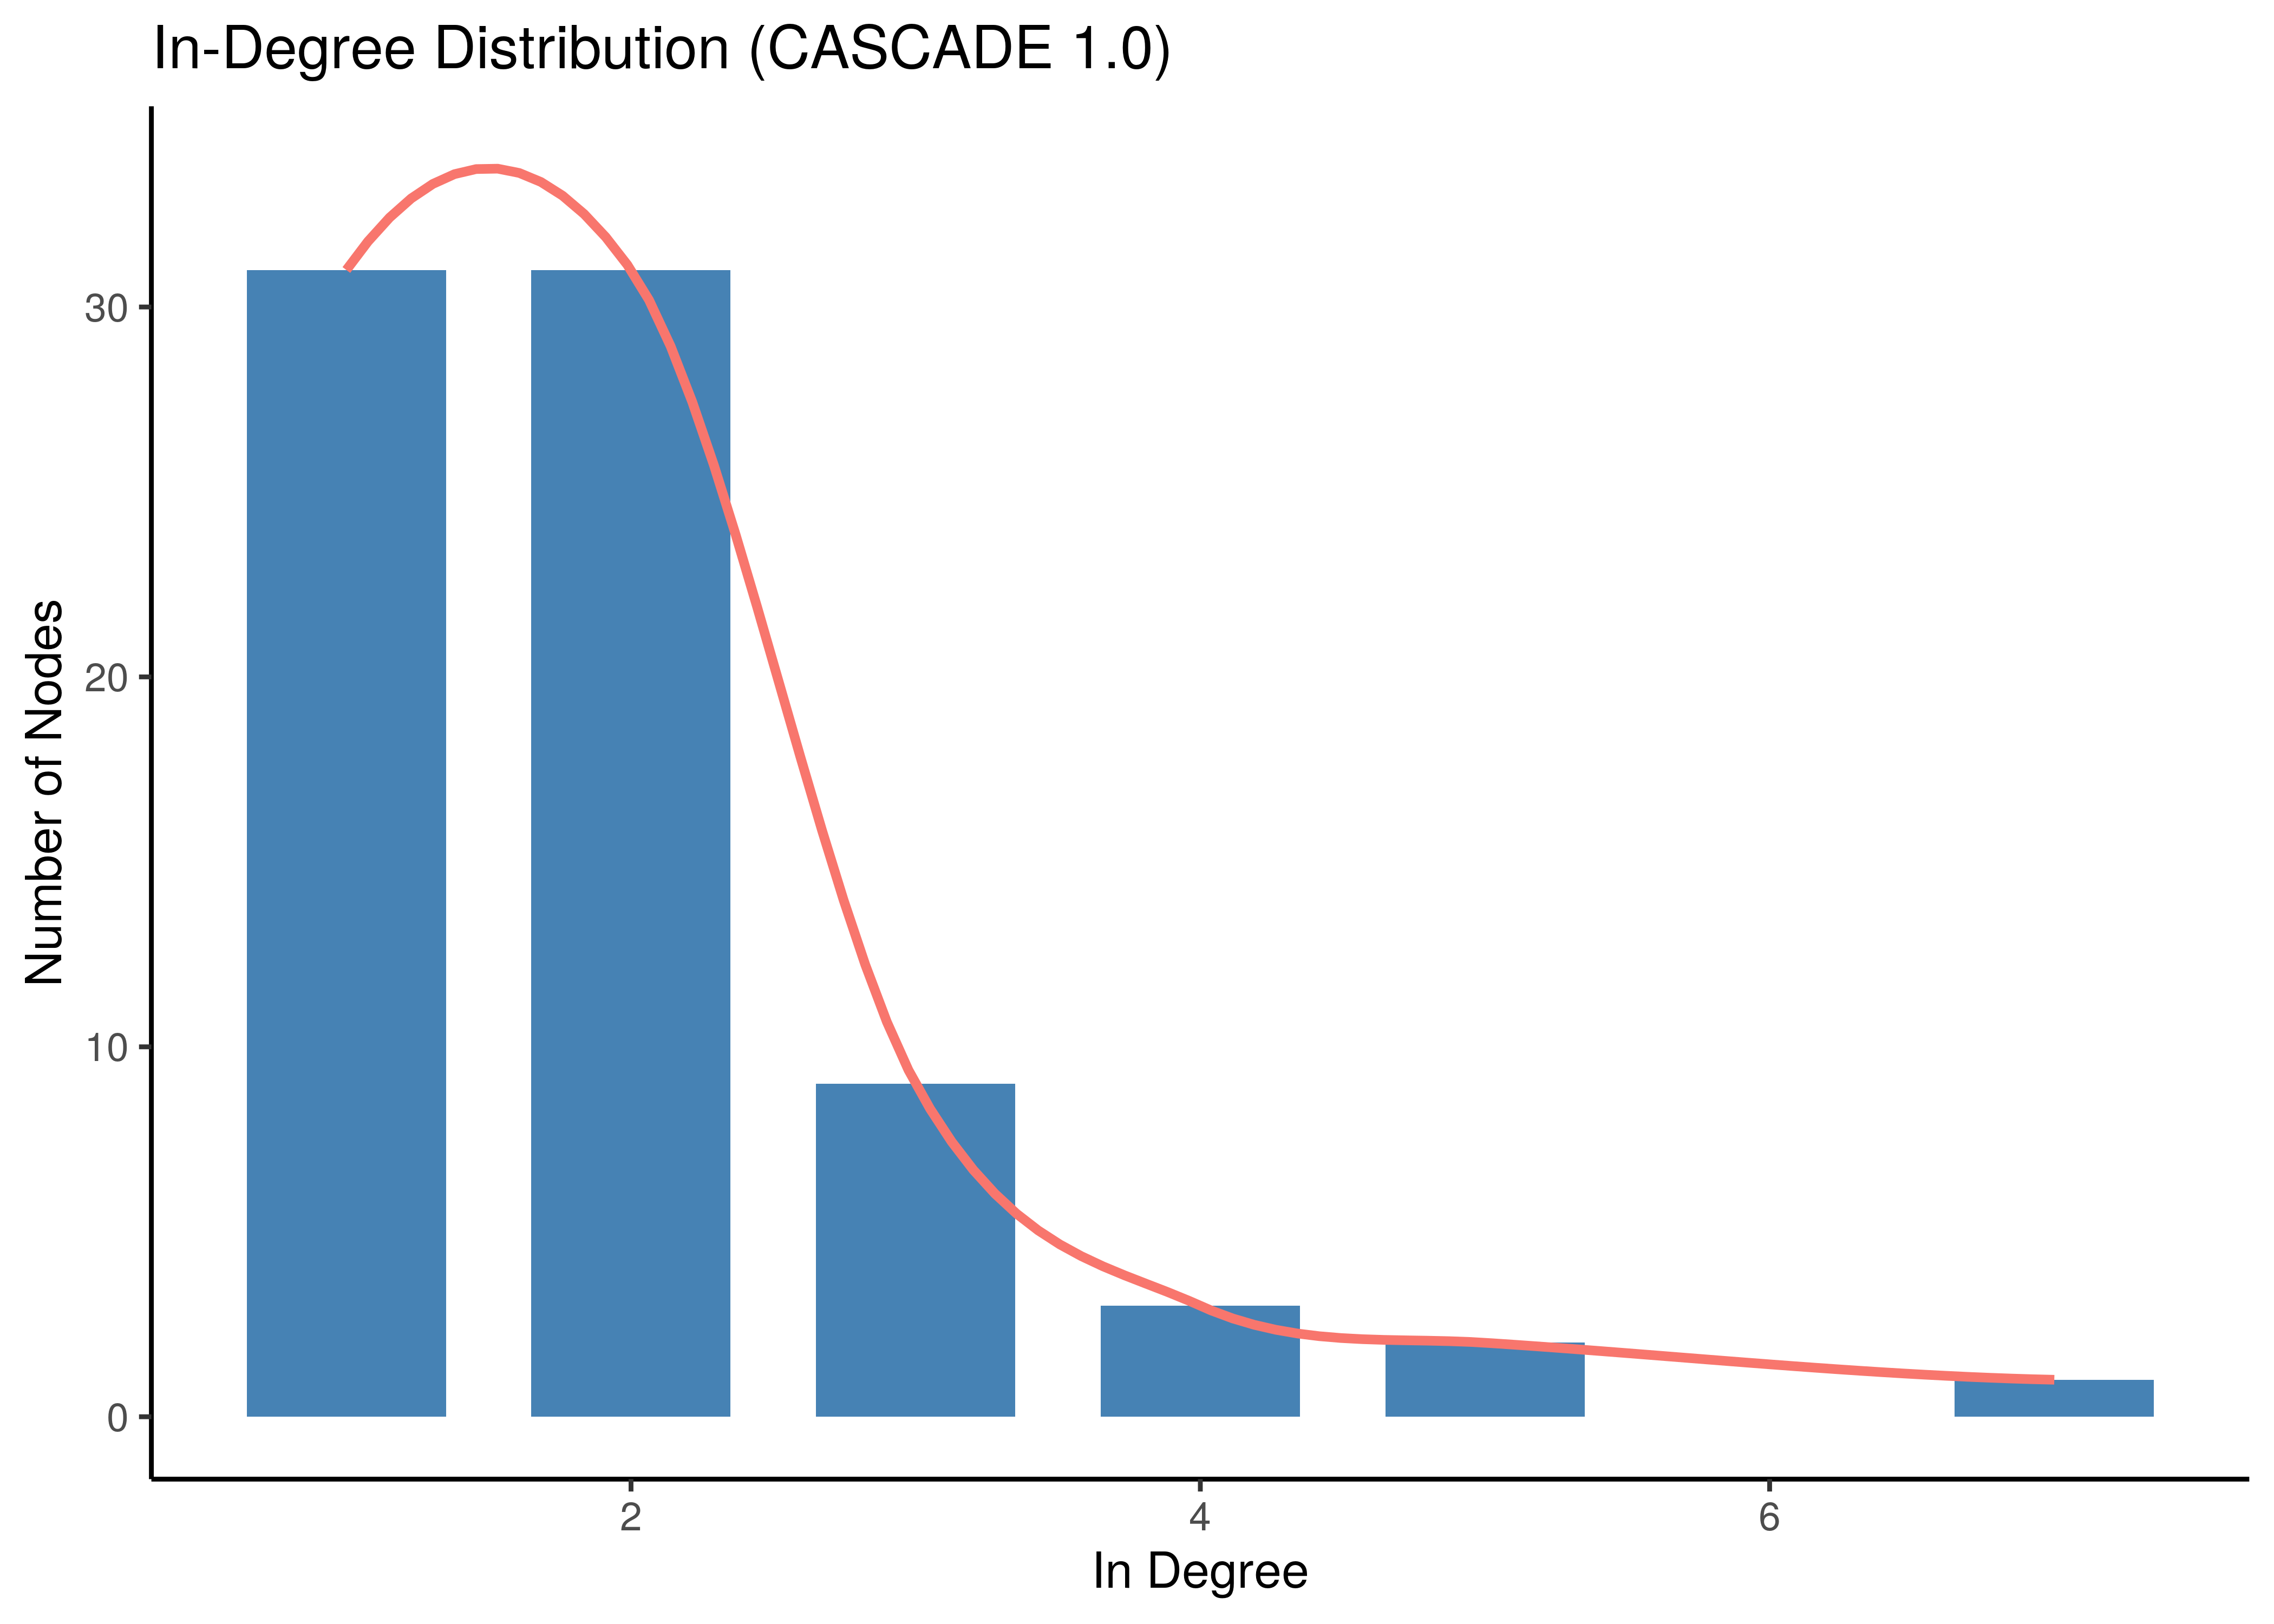
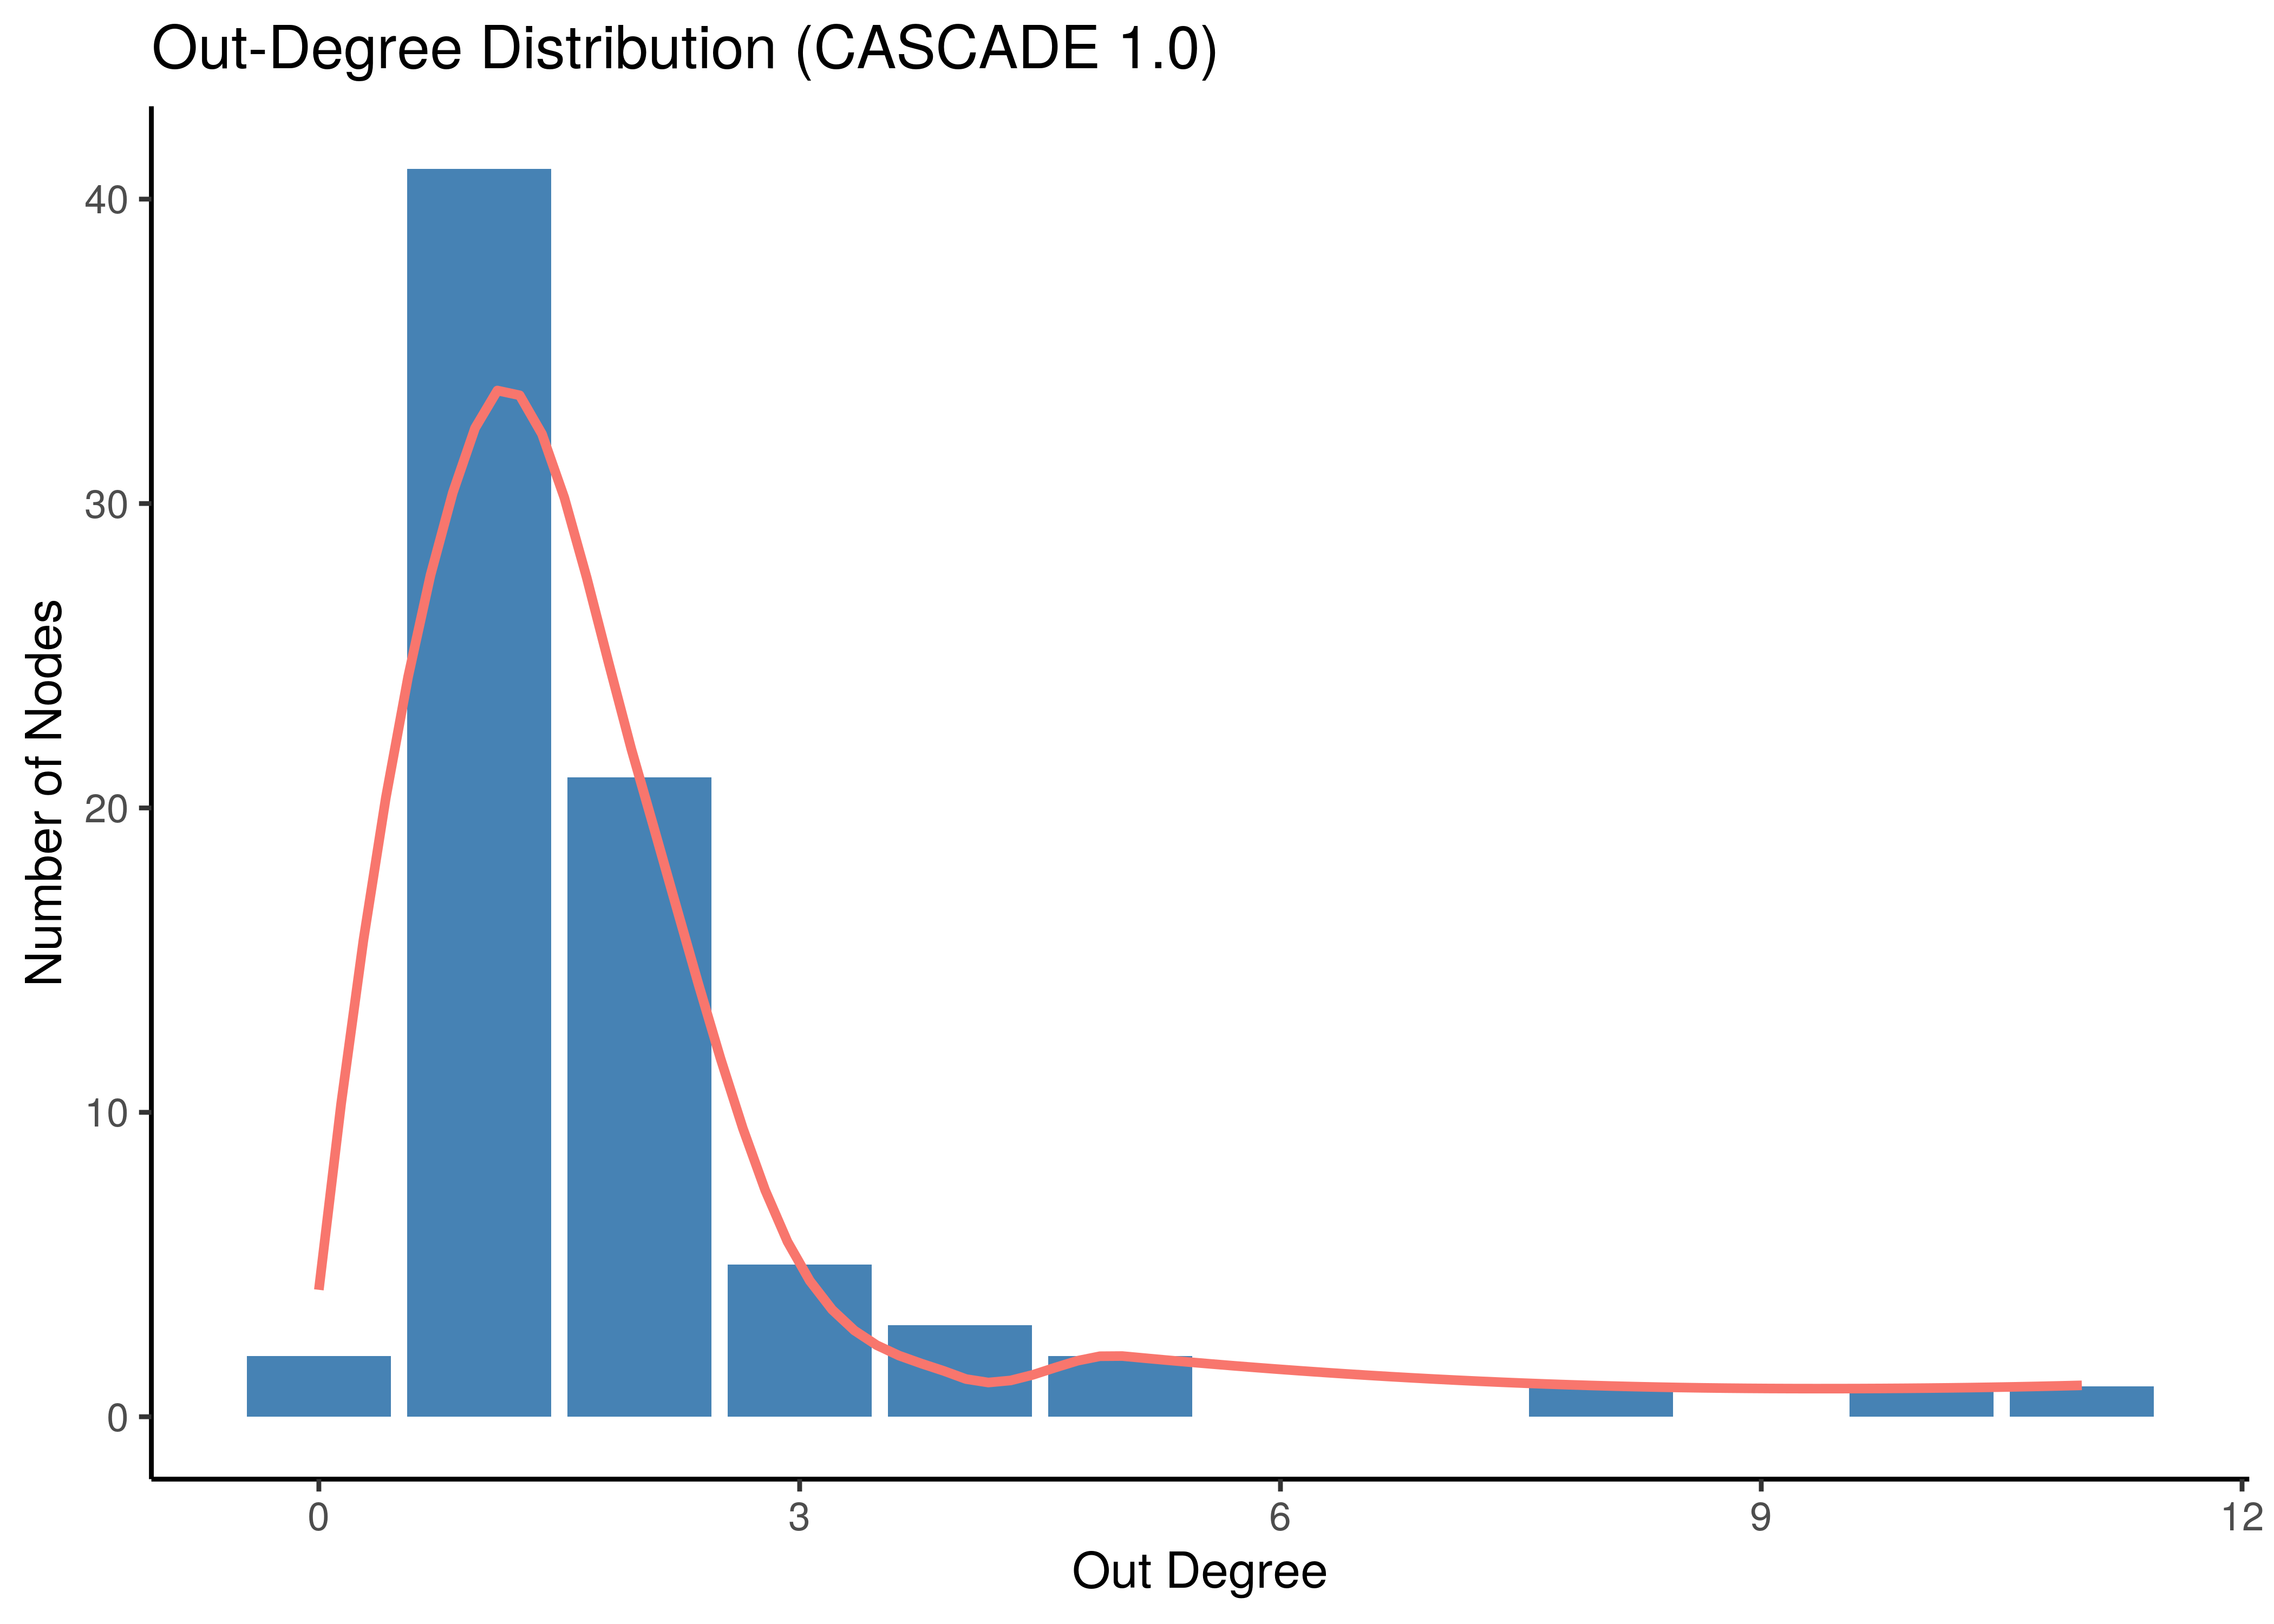
In this section we demonstrate the scale-free properties of the CASCADE 1.0 network. We show that both in- and out-degree distributions are asymptotically power-law.
Use the script get_distribution_stats.R to generate the degree distribution stats. We load the results:
dd_stats %>% group_by(in_degree) %>% tally() %>%
  ggplot(aes(x = in_degree, y = n)) +
  geom_bar(stat = "identity", fill = "steelblue", width = 0.7) +
  geom_smooth(aes(color = "red"), se = FALSE, show.legend = FALSE) +
  theme_classic() +
  labs(title = "In-Degree Distribution (CASCADE 1.0)", x = "In Degree", y = "Number of Nodes")

dd_stats %>% group_by(out_degree) %>% tally() %>%
  ggplot(aes(x = out_degree, y = n)) +
  geom_bar(stat = "identity", fill = "steelblue") +
  geom_smooth(aes(color = "red"), se = FALSE, span = 0.58, show.legend = FALSE) +
  theme_classic() +
  labs(title = "Out-Degree Distribution (CASCADE 1.0)", x = "Out Degree", y = "Number of Nodes")

Figure 1: Degree Distribution (CASCADE 1.0)
Model Stable State Statistics
The gitsbe files of the model dataset include also the fixpoint attractors of each model (.bnet files have only the equations).
Thus we can find the frequency distribution of the number of fixpoints across all produced models (use the script count_models_ss.R).
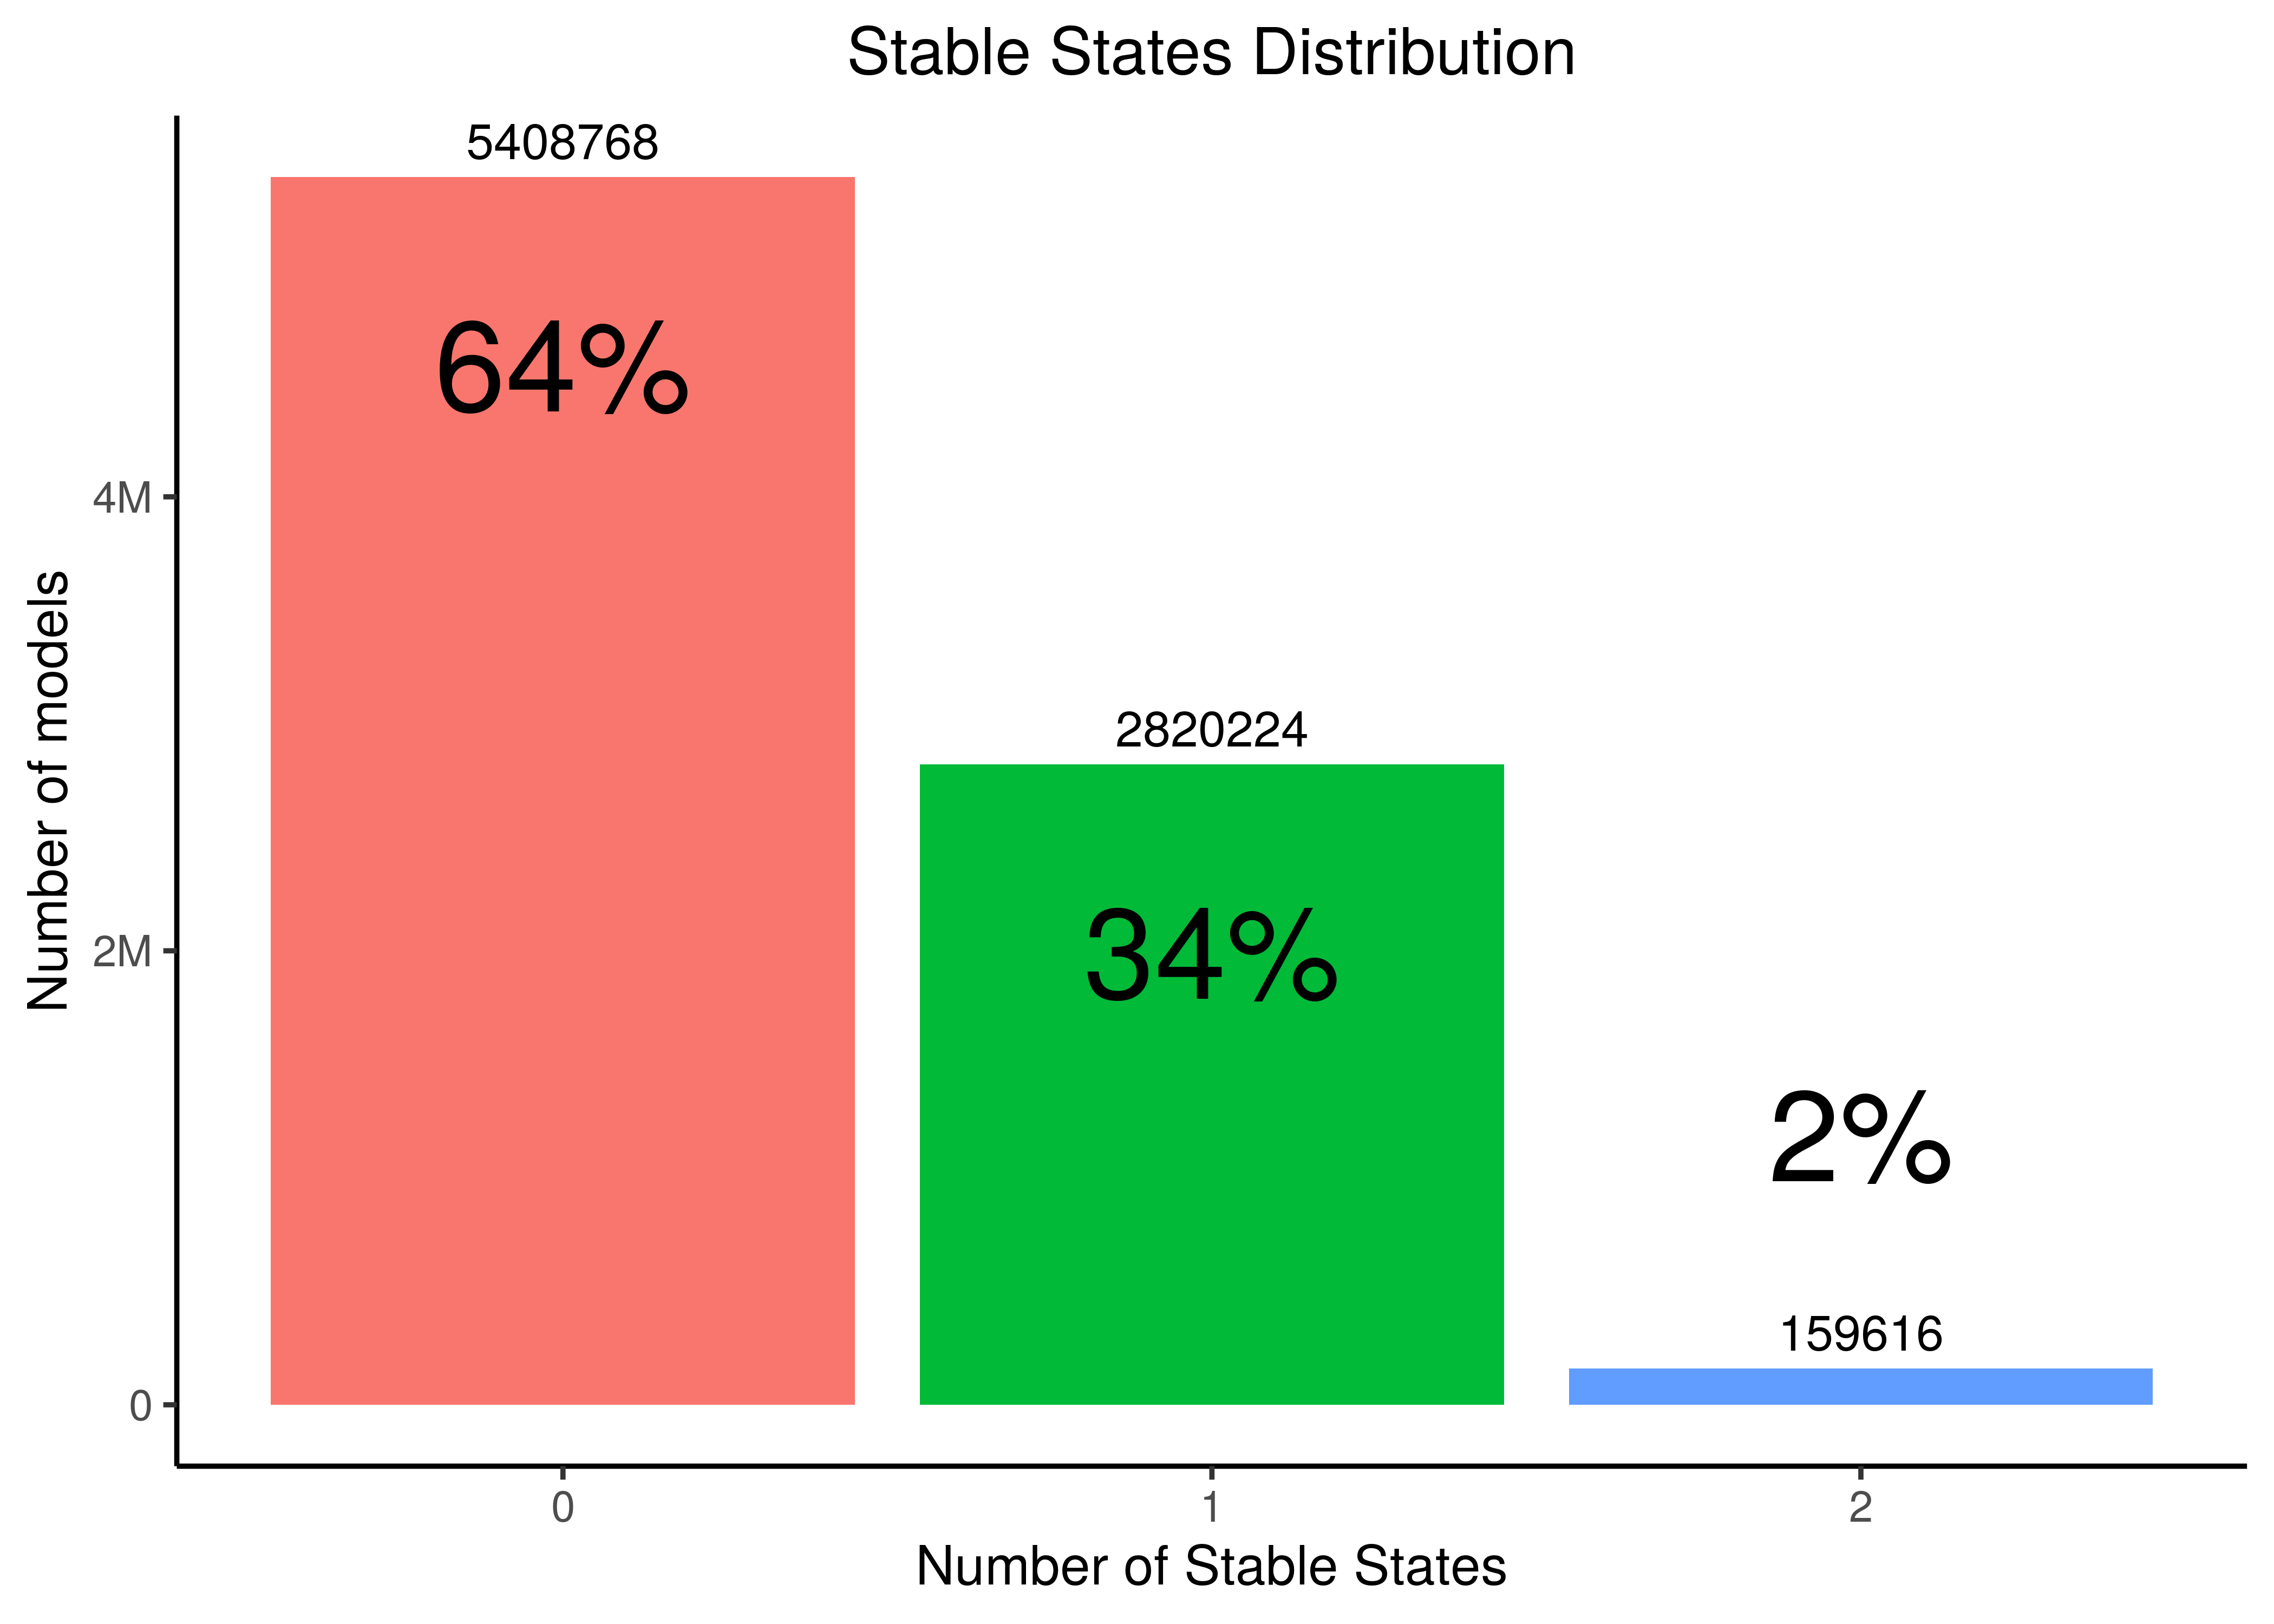
The model stable state (fixpoint) statistics are as follows:
models_ss_stats = readRDS(file = "data/models_ss_stats.rds")

models_ss_stats %>% group_by(ss_num) %>% tally() %>%
  ggplot(aes(x = ss_num, y = n, fill = as.factor(ss_num))) +
  geom_bar(stat = "identity", show.legend = FALSE) +
  scale_y_continuous(labels = scales::label_number_si()) +
  geom_text(aes(label = n), vjust = -0.5) +
  geom_text(aes(label = paste0(100 * round(n/nrow(models_ss_stats), digits = 2), "%")), size = 10, vjust = c(2.5, 2.5, -2)) +
  theme_classic2() +
  theme(plot.title = element_text(hjust = 0.5)) +
  labs(title = "Stable States Distribution", x = "Number of Stable States", y = "Number of models")
Figure 2: Stable States Distribution across all link-operator parameterized models (CASCADE 1.0)
Less than \(50\%\) of the total possible parameterized models have a single fixpoint attractor which corresponds to a single stable phenotype behavior.